
Date: Fri, Dec 26, 2025 | 06:30 PM GMT
The broader cryptocurrency market has been navigating a period of choppy and uncertain price action over the past several weeks, a phase that began after the sharp market-wide sell-off on October 10. During that correction, Ethereum (ETH) dropped nearly 28% over the last 60 days, applying sustained pressure across the altcoin sector — including ether.fi (ETHFI).
ETHFI has mirrored this weakness, sliding more than 31% over the same period. However, despite the sharp downtrend, recent price behavior suggests selling pressure may be easing. The token is now trading near a historically significant demand zone, where buyers have repeatedly stepped in before — raising the possibility that ETHFI could be approaching an inflection point.
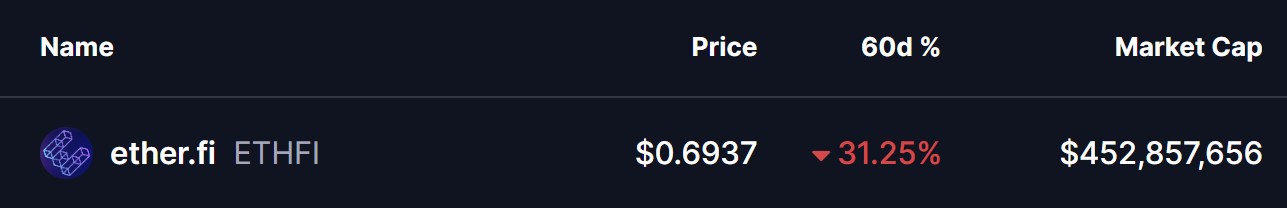
Source: Coinmarketcap
Double Bottom Pattern in Focus
On the daily timeframe, ETHFI appears to be forming a potential double-bottom structure — a classic reversal pattern that often signals exhaustion among sellers. The setup began after ETHFI was rejected from the $0.9233 resistance area, a move that triggered a sharp decline of nearly 28% and pushed price back toward the lower end of its range.
That sell-off dragged ETHFI into the $0.65 support zone, a level that has consistently acted as a strong demand area in the past. The chart now shows price revisiting this same region and stabilizing once again, suggesting buyers are actively defending it. The similarity between the first and second lows strengthens the case that a double-bottom base may be forming.
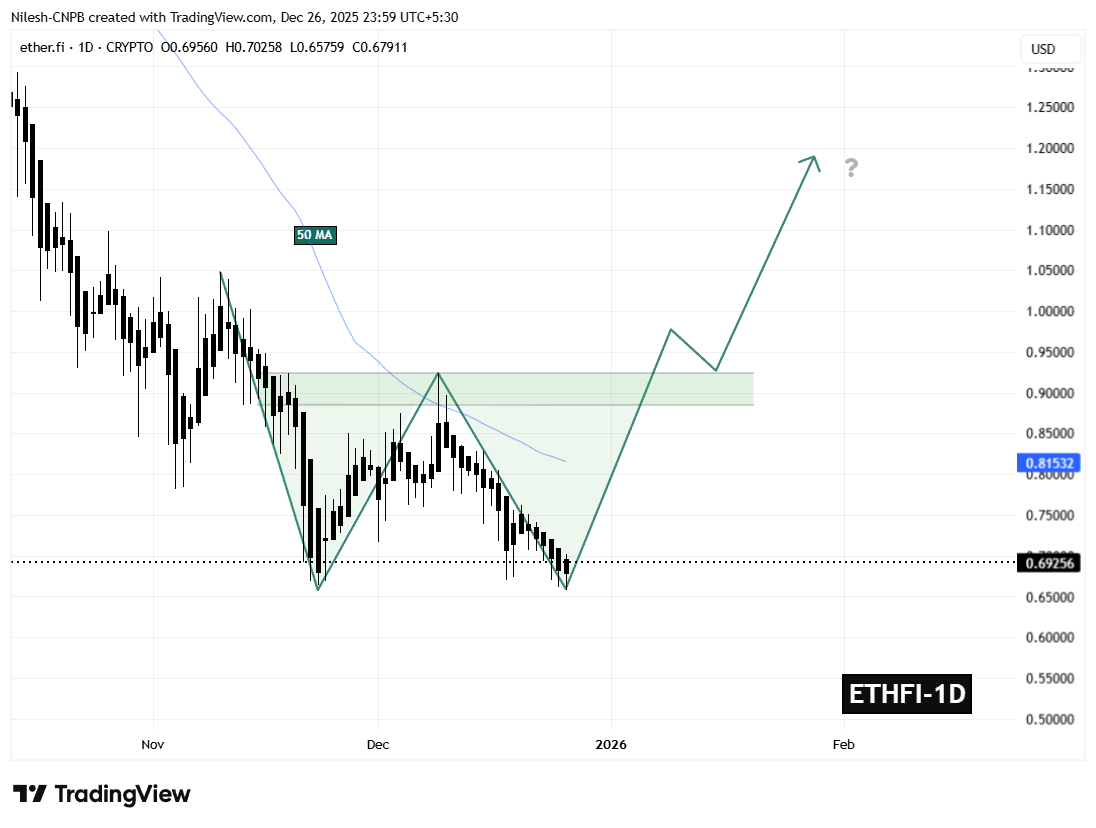
ETHFI Daily Chart/Coinsprobe (Source: Tradingview)
If this support continues to hold, the ongoing consolidation could mark the completion of the second bottom — a critical step in shifting momentum away from sellers and toward a potential trend reversal.
What’s Next for ETHFI?
The $0.65 support zone remains the most important level to monitor in the near term. As long as ETHFI holds above this area, the developing bullish structure remains valid and provides room for momentum to gradually rebuild.
On the upside, the first major challenge sits at the 50-day moving average near $0.8153. This level has repeatedly capped recovery attempts throughout the recent downtrend and now represents the initial test for buyers. A sustained move above this moving average would signal improving market structure and growing bullish confidence.
Beyond that, the $0.9233 neckline stands as the key confirmation level. A decisive breakout above this resistance would complete the double-bottom pattern and significantly strengthen the bullish outlook, potentially opening the door for a broader recovery move in the weeks ahead.
For now, ETHFI finds itself at a technically pivotal zone — one that could either reinforce the existing downtrend or mark the beginning of a meaningful rebound if buyers continue to defend support.
Disclaimer: The views and analysis presented in this article are for informational purposes only and reflect the author’s perspective, not financial advice. Technical patterns and indicators discussed are subject to market volatility and may or may not yield the anticipated results. Investors are advised to exercise caution, conduct independent research, and make decisions aligned with their individual risk tolerance.
Disclaimer: The information on this page may come from third parties and does not represent the views or opinions of Gate. The content displayed on this page is for reference only and does not constitute any financial, investment, or legal advice. Gate does not guarantee the accuracy or completeness of the information and shall not be liable for any losses arising from the use of this information. Virtual asset investments carry high risks and are subject to significant price volatility. You may lose all of your invested principal. Please fully understand the relevant risks and make prudent decisions based on your own financial situation and risk tolerance. For details, please refer to
Disclaimer.
Related Articles
Crypto Market Sees Wider Rebound As $ETH and $BTC Lead Gains Despite Fearful Sentiment
The crypto market experienced a 2.23% gain, reaching a $2.36T market cap, with Bitcoin and Ethereum rising 3.17% and 3.78%, respectively. Notable gainers included $TRUMP, $GROK, and $MAGA. DeFi TVL increased by 1.72%, while NFT sales rose 5.79%. HypurrFi warned users of domain hijacking, and Apple removed Bitchat from China.
BlockChainReporter31m ago
Bitcoin rallies on report of Iran ceasefire talks, Algorand extends gains
Bitcoin BTC$69,892.51 climbed to near $70,000 as traders reacted to signs of possible de-escalation in the Iran war and amid a short squeeze that liquidated more than $270 million in shorts.
Crypto prices rose, along with equity index futures and equities, as Axios reported that the U.S. and Iran a
CoinDesk53m ago
Chainlink Sees 25% Whale Growth: Will LINK Push Toward $27?
Chainlink whales grew 25% in a year, signaling strong accumulation by large holders.
Institutional adoption and reserve growth tighten LINK supply, supporting potential upward price movement.
LINK trades in a narrow range; a breakout could push toward $27.
Chainlink — LINK, has been
CryptoNewsLand2h ago
Hyperliquid Faces Volatility as Whales Shift Positions: Will HYPE Hold $35?
Whale activity drives HYPE volatility, creating uncertainty around short-term price movements.
Accumulation trends remain strong, with investors moving $11.7 million HYPE off exchanges.
Key support at $33.48–$35.19 may determine whether HYPE rebounds or drops further.
Hyperliquid — HYPE,
CryptoNewsLand3h ago
BTC profit/loss trade ratio is 2.95, the highest level in 12 weeks
Gate News message: On April 6, according to Santiment data, the BTC profit-loss trade ratio reached 2.95, the highest level in 12 weeks. This indicator measures the ratio of profitable trades to losing trades; the current value shows that the share of profitable trades in the market is significantly higher than that of losing trades, reaching a recent peak level.
GateNews4h ago
