Date: Sun, Dec 28, 2025 | 09:40 AM GMT
The broader cryptocurrency market is showing modest strength, with both Bitcoin (BTC) and Ethereum (ETH) trading in the green. This steady performance among major assets has helped stabilize overall sentiment, allowing select memecoins — including SPX6900 (SPX) — to begin showing constructive technical setups.
SPX is trading with a modest intraday gain, but more importantly, its price structure is starting to reflect a classic bullish reversal pattern. After weeks of sustained downside pressure, buyers appear to be stepping back in at key levels, hinting that the worst of the correction may already be behind.
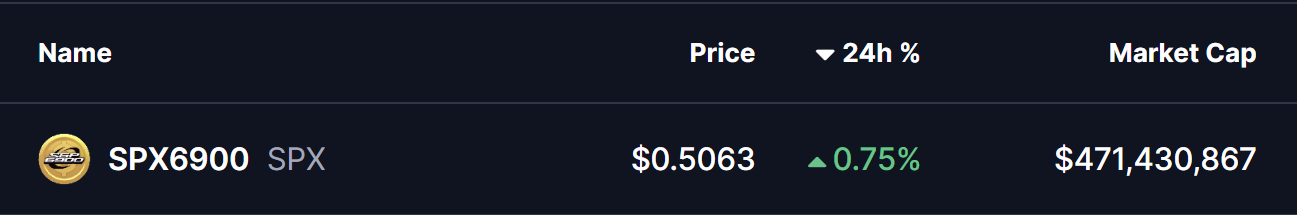
Source: Coinmarketcap
Double Bottom Pattern in Play
On the daily timeframe, SPX is forming a double bottom pattern — a widely followed bullish reversal structure that often appears near the end of prolonged downtrends. The first bottom formed in November when SPX dropped toward the $0.45 region, followed by a recovery that carried price back toward the neckline resistance near $0.7389 in early December.
That recovery attempt, however, was rejected, sending SPX back down to retest the same $0.45 support zone. Importantly, sellers failed to push price meaningfully lower on this second attempt. Instead, SPX printed another strong reaction from the same demand area and has since rebounded to trade around $0.5045.
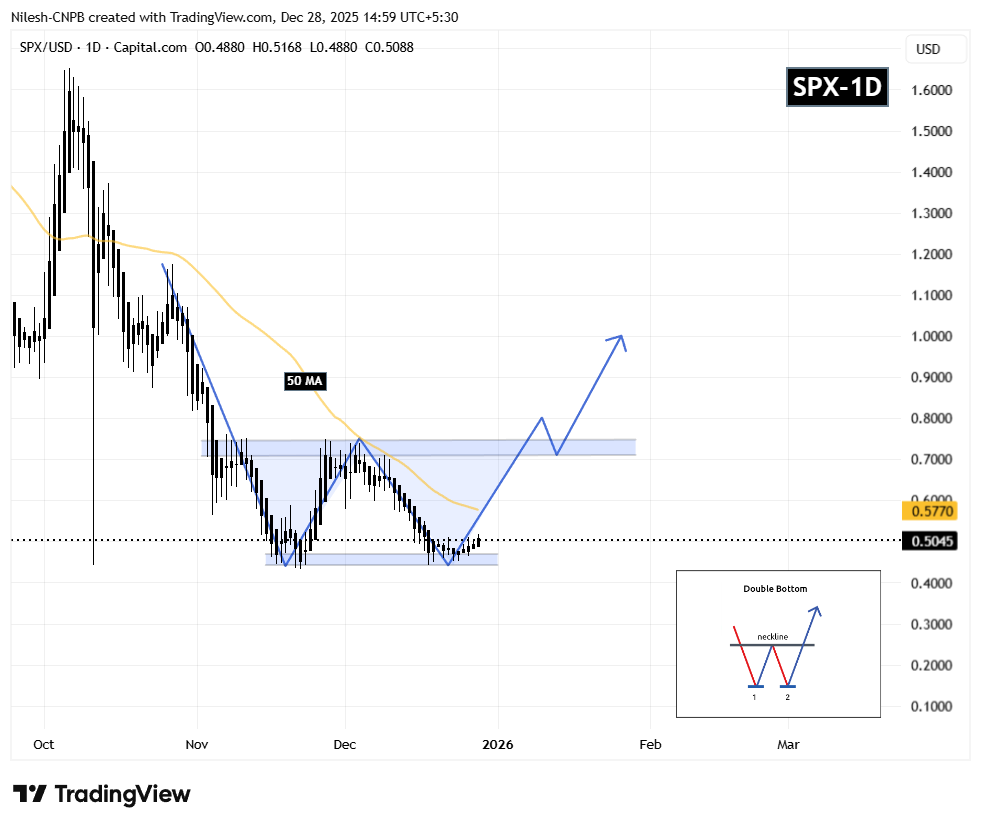
SPX6900 (SPX) Daily Chart/Coinsprobe (Source: Tradingview)
This repeated defense of the same support level is a critical technical signal. It suggests that selling pressure is weakening while buyers are gradually absorbing supply — a behavior typically seen during accumulation phases before trend reversals.
What’s Next for SPX?
For the bullish structure to strengthen, SPX must reclaim the 50-day moving average, currently positioned near $0.5770. A sustained move above this level would mark an important shift in short-term momentum and increase the probability of a continued recovery toward the neckline resistance at $0.7389.
A decisive breakout above the neckline — ideally followed by a successful retest — would confirm the full activation of the double bottom pattern. In that scenario, the technical projection points toward a potential upside target near $1.02, representing a significant expansion from current price levels.
Until then, the $0.45 support zone remains the most important level to watch. As long as SPX continues to hold above this area, the broader bullish setup stays intact and allows room for further upside attempts.
Overall, SPX’s structure appears constructive. The presence of a double bottom, repeated demand at identical lows, and proximity to the 50-day moving average suggest that this could be a pivotal moment as the token attempts to transition from accumulation into a new expansion phase.
Disclaimer: The views and analysis presented in this article are for informational purposes only and reflect the author’s perspective, not financial advice. Technical patterns and indicators discussed are subject to market volatility and may or may not yield the anticipated results. Investors are advised to exercise caution, conduct independent research, and make decisions aligned with their individual risk tolerance.
About Author: Nilesh Hembade is the Founder and Lead Author of Coinsprobe, with over 5 years of experience in the cryptocurrency and blockchain industry. Since launching Coinsprobe in 2023, he has been providing daily, research-driven insights through in-depth market analysis, on-chain data, and technical research.

Disclaimer: The information on this page may come from third parties and does not represent the views or opinions of Gate. The content displayed on this page is for reference only and does not constitute any financial, investment, or legal advice. Gate does not guarantee the accuracy or completeness of the information and shall not be liable for any losses arising from the use of this information. Virtual asset investments carry high risks and are subject to significant price volatility. You may lose all of your invested principal. Please fully understand the relevant risks and make prudent decisions based on your own financial situation and risk tolerance. For details, please refer to
Disclaimer.
Related Articles
Bitcoin Faces Extended Weakness Below Key Cost Basis
Bitcoin struggles below the $72.5K realized price, indicating resistance and prolonged bearish sentiment. Repeated rejections at $71K and a drop to $66K demonstrate strong selling pressure. Indicators suggest fragile recovery, with risks of further declines if support fails.
CryptoFrontNews4m ago
The cryptocurrency market's trading volume has dropped back to the levels of the 2022 bear market, with ETH's trading volume decreasing more than BTC's, and Gas fees hitting an all-time low.
The average weekly trading volume in the cryptocurrency market has fallen to $90 billion, a decrease of 7% from the mean, indicating that activity has dropped to levels seen during the bear market of 2022; Ethereum gas fees have fallen to historic lows, reflecting a contraction in on-chain activity. Both Bitcoin and Ethereum trading volumes are below the average, with funding rates recovering but still at low levels. The market is currently in a quiet state, lacking clear catalysts.
動區BlockTempo15m ago
RAIN Crypto Price Dips: Will the $10M Sell-Off Halt Recovery?
RAIN drops over 17% after $10M sell-off despite institutional support.
RAIN trades below key $0.0082 support, raising concerns about market cap decline.
Whale activity and green candles suggest potential rebound if momentum sustains.
Rain Protocol — RAIN, has seen a sharp decline,
CryptoNewsLand29m ago
‘Extreme Fear’ Is Back but Bitcoin’s Price Recovery Depends on it: Santiment
Bitcoin dipped to a four-week low on Friday at $65,500 after it was rejected at $72,000 a few days earlier, which pushed the overall market sentiment back to ‘extreme fear’ territory.
However, the analysts from Santiment believe this could be the precise push BTC needs to stage a notable
CryptoPotato1h ago
XRP Price Analysis: A whale continues to buy, and $1.30 is a key support level
As of the end of March 2026, the price of XRP fluctuates around $1.32, facing key support. The weekly RSI is close to oversold, indicating a potential rebound. If it falls below $1.30, the support levels are at $1.24 and $1.20. Whales continue to accumulate, showing long-term accumulation intent, but on-chain activity is declining, and market liquidity is insufficient.
GateNews1h ago
Ethereum may lose its second place! The rise of stablecoins impacts the global cryptocurrency market capitalization ranking.
Ethereum faces market pressure and is expected to lose its second-place spot in 2026, with the probability rising to 59%. The rapid expansion of stablecoins has brought their market value significantly closer to Ethereum. Analysis says Ethereum needs to maintain network usage and price to meet the competition, and to focus on whether it can preserve its core position.
GateNews1h ago
