Date: Sun, Dec 28, 2025 | 09:40 AM GMT
The broader cryptocurrency market is showing modest strength, with both Bitcoin (BTC) and Ethereum (ETH) trading in the green. This steady performance among major assets has helped stabilize overall sentiment, allowing select memecoins — including SPX6900 (SPX) — to begin showing constructive technical setups.
SPX is trading with a modest intraday gain, but more importantly, its price structure is starting to reflect a classic bullish reversal pattern. After weeks of sustained downside pressure, buyers appear to be stepping back in at key levels, hinting that the worst of the correction may already be behind.
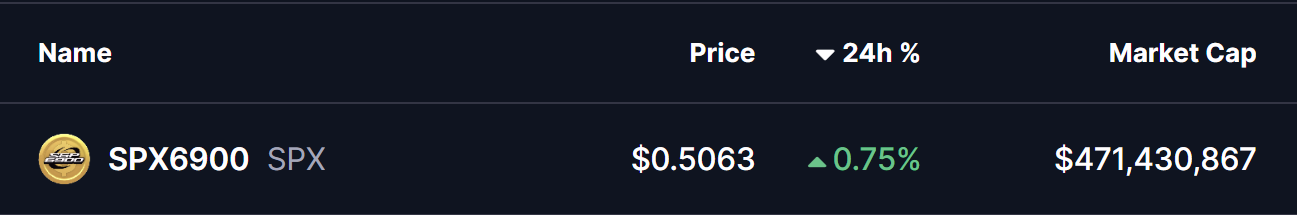
Source: Coinmarketcap
Double Bottom Pattern in Play
On the daily timeframe, SPX is forming a double bottom pattern — a widely followed bullish reversal structure that often appears near the end of prolonged downtrends. The first bottom formed in November when SPX dropped toward the $0.45 region, followed by a recovery that carried price back toward the neckline resistance near $0.7389 in early December.
That recovery attempt, however, was rejected, sending SPX back down to retest the same $0.45 support zone. Importantly, sellers failed to push price meaningfully lower on this second attempt. Instead, SPX printed another strong reaction from the same demand area and has since rebounded to trade around $0.5045.
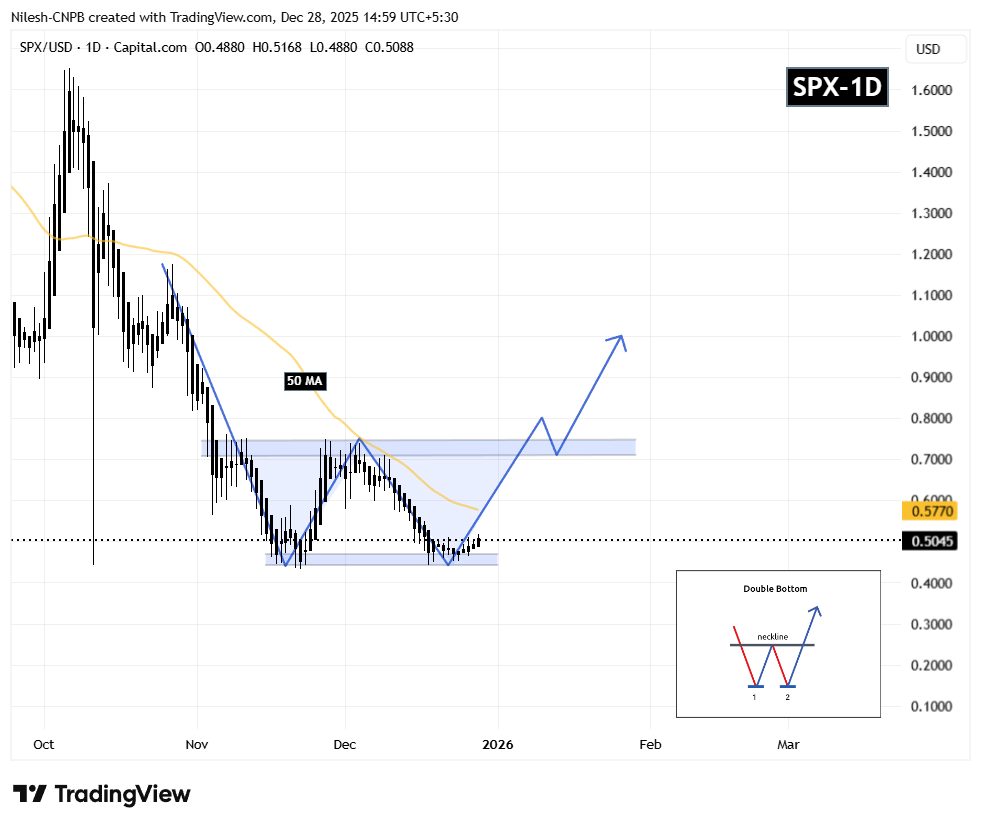
SPX6900 (SPX) Daily Chart/Coinsprobe (Source: Tradingview)
This repeated defense of the same support level is a critical technical signal. It suggests that selling pressure is weakening while buyers are gradually absorbing supply — a behavior typically seen during accumulation phases before trend reversals.
What’s Next for SPX?
For the bullish structure to strengthen, SPX must reclaim the 50-day moving average, currently positioned near $0.5770. A sustained move above this level would mark an important shift in short-term momentum and increase the probability of a continued recovery toward the neckline resistance at $0.7389.
A decisive breakout above the neckline — ideally followed by a successful retest — would confirm the full activation of the double bottom pattern. In that scenario, the technical projection points toward a potential upside target near $1.02, representing a significant expansion from current price levels.
Until then, the $0.45 support zone remains the most important level to watch. As long as SPX continues to hold above this area, the broader bullish setup stays intact and allows room for further upside attempts.
Overall, SPX’s structure appears constructive. The presence of a double bottom, repeated demand at identical lows, and proximity to the 50-day moving average suggest that this could be a pivotal moment as the token attempts to transition from accumulation into a new expansion phase.
Disclaimer: The views and analysis presented in this article are for informational purposes only and reflect the author’s perspective, not financial advice. Technical patterns and indicators discussed are subject to market volatility and may or may not yield the anticipated results. Investors are advised to exercise caution, conduct independent research, and make decisions aligned with their individual risk tolerance.
About Author: Nilesh Hembade is the Founder and Lead Author of Coinsprobe, with over 5 years of experience in the cryptocurrency and blockchain industry. Since launching Coinsprobe in 2023, he has been providing daily, research-driven insights through in-depth market analysis, on-chain data, and technical research.

Disclaimer: The information on this page may come from third parties and does not represent the views or opinions of Gate. The content displayed on this page is for reference only and does not constitute any financial, investment, or legal advice. Gate does not guarantee the accuracy or completeness of the information and shall not be liable for any losses arising from the use of this information. Virtual asset investments carry high risks and are subject to significant price volatility. You may lose all of your invested principal. Please fully understand the relevant risks and make prudent decisions based on your own financial situation and risk tolerance. For details, please refer to
Disclaimer.
Related Articles
The Crypto Fear and Greed Index rose to 17 today, and the market remains in a state of extreme fear
Gate News message: On April 8, according to Alternative.me data, the crypto Fear and Greed Index rose to 17 today, up from 11 yesterday (April 7), but the market overall is still in a state of “extreme fear.”
GateNews2m ago
Bitcoin reclaims $72K after US, Iran agree to 2-week ceasefire
Bitcoin surged past $72,000 after a two-week ceasefire between the US and Iran was announced. Traders often react positively to eased geopolitical tensions, despite overall market fear.
Cointelegraph2m ago
BTC drops 1.03% in 15 minutes: tighter macro liquidity and derivatives synchronized to amplify sell-off pressure
From 23:30 to 23:45 (UTC) on 2026-04-07, the BTC price rapidly fell within 15 minutes, with a return of -1.03%. The price range was 71,905.7 to 72,760.5 USDT, and the amplitude was 1.17%. Market attention remained high; intraday volatility significantly increased. Trading volumes across major platforms briefly surged, indicating that selling pressure and risk-avoidance sentiment had permeated mainstream cryptocurrencies.
The main drivers of this deviation were the continued tightening of macro liquidity under the Fed’s hawkish signals and a concentrated adjustment in the BTC derivatives market. The Fed’s interest rate in March 2026
GateNews56m ago
Peter Schiff Challenges Michael Saylor as Bitcoin Debate Heats Up
Peter Schiff and Michael Saylor recently debated Bitcoin's performance, with Schiff arguing it underperformed gold and equities over five years, while Saylor highlighted shorter-term gains. Their dispute illustrates the complexity of data selection in assessing investment viability.
CryptoFrontNews1h ago
BTC 15-minute surge of 1.07%: On-chain activity spikes and ETF fund inflows synchronize to drive the move
2026-04-07 22:45 to 2026-04-07 23:00 (UTC), the BTC price recorded a +1.07% return. The price range was 70,733.5 to 71,518.9 USDT, with a 1.11% amplitude. Short-term volatility intensified, drawing strong market attention. On-chain data shows the number of active addresses rose to 38,971, up 5.2% from the previous hour. The total number of addresses added approximately 252,780 within an hour; network activity and new user growth increased significantly, becoming the incremental market momentum behind the unusual move. Spot trading volume reached 11
GateNews1h ago
ETH 15-minute increase of 0.64%: Short-term capital inflows and sentiment shifts drive price fluctuations
2026-04-07 22:00 to 22:15 (UTC), the ETH price ranged between 2145.02 and 2165.83 USDT, and the 15-minute candlestick return reached +0.64%, with a trading range (amplitude) of 0.97%. Market volatility increased and attention rose, indicating short-term activity driven by rapid capital flows.
The main driving force behind this unusual move is that, in the short term, some funds flowed into ETH. Investors are focusing on ETH mainnet assets, and buying interest increased, pushing spot prices higher. At the same time, DeFi and stablecoin-related trading remained active, boosting on-chain liquidity and helping to support a
GateNews2h ago
