
**Date: **Mon, Jan 05, 2026 | 07:55 AM GMT
As 2026 kicks off, the broader cryptocurrency market is showing renewed stability. Ethereum (ETH) is up around 4% on the week, and improving sentiment is gradually spreading across major altcoins — including Ethena (ENA).
ENA has already surged more than 14% on a weekly basis, but the more important development is unfolding beneath the surface. While short-term strength is encouraging, the bigger story lies in the structure forming on the chart. Recent price action suggests a meaningful shift in market behavior — one that could mark the early stages of a bullish continuation if key resistance levels are reclaimed.
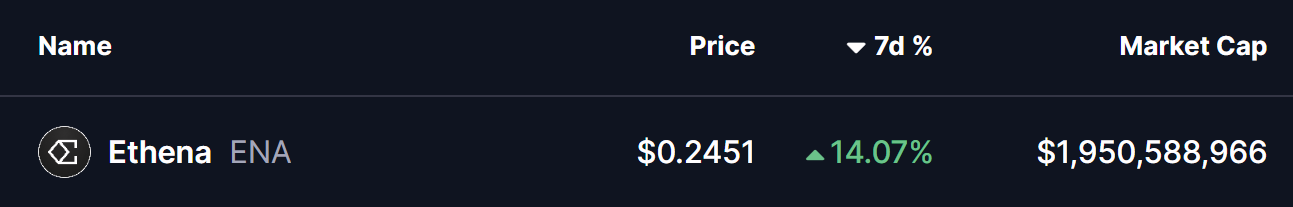
Source: Coinmarketcap
Rounding Bottom in Play
On the daily timeframe, ENA appears to be forming a rounding bottom pattern, a classic bullish reversal structure that typically develops after a prolonged corrective phase.
The setup began after ENA faced a firm rejection near the $0.3028–$0.2837 resistance zone late last month. That rejection triggered a sharp decline, dragging price down toward the $0.1935 area. Importantly, sellers failed to push price meaningfully lower from there, and strong demand emerged at those levels. Over time, ENA stabilized, volatility compressed, and price began to curl higher — completing the rounded base structure.
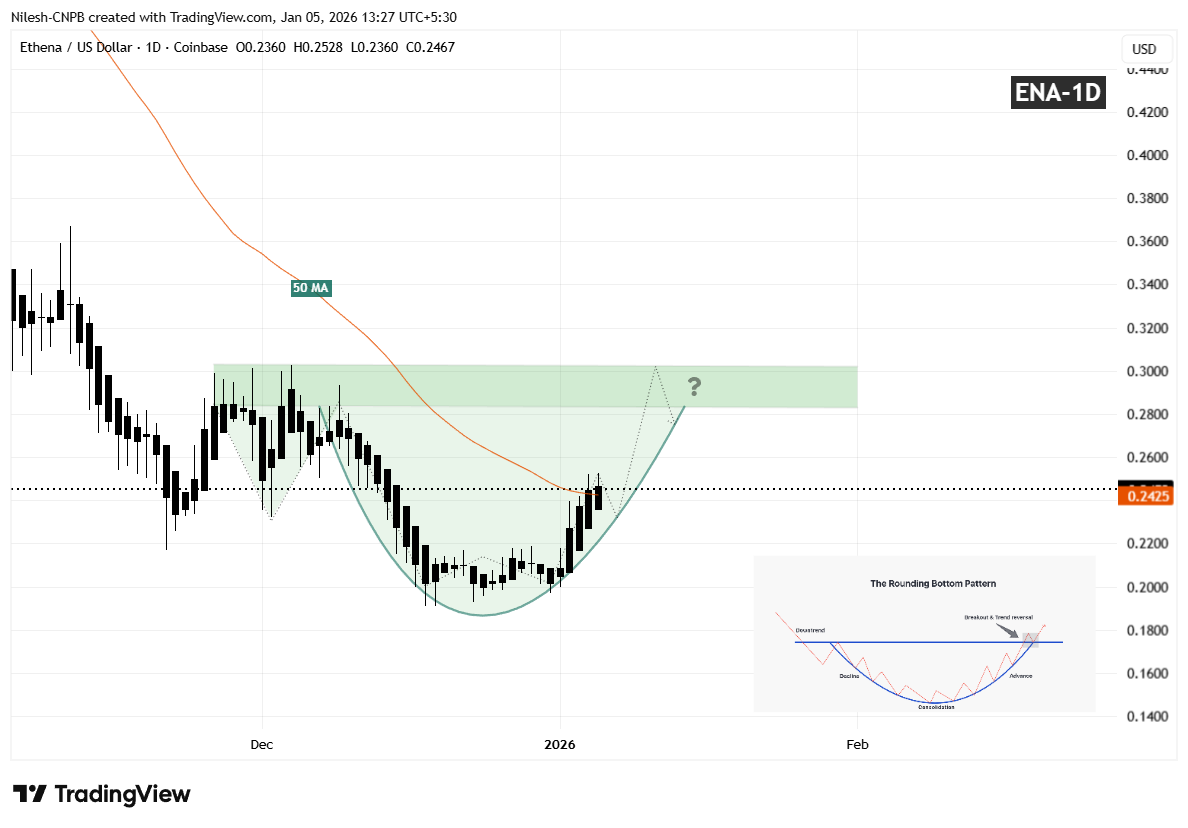
Ethena (ENA) Daily Chart/Coinsprobe (Source: Tradingview)
Since carving out that bottom, ENA has started to move higher in a smooth, rounded fashion, closely matching the textbook characteristics of a developing rounding bottom. The recent recovery has also brought price back toward the 50-day moving average near $0.2451, a level that previously acted as resistance and is now being tested as potential support.
What’s Next for ENA?
If ENA continues to hold above the 50-day MA, that level could act as a solid short-term base for further upside attempts. A clean and decisive breakout above the $0.3028–$0.2837 resistance zone, followed by sustained acceptance above it, would validate the entire reversal pattern and likely open the door for a broader bullish expansion phase.
Until such a breakout occurs, the pattern remains in development. Short-term consolidation or shallow pullbacks remain possible as price digests recent gains. However, as long as ENA continues to form higher lows above the established base, the broader bottoming structure remains intact and constructive.
For now, the chart suggests ENA is approaching a critical confirmation phase — one that could determine whether this recovery evolves into a sustained bullish trend as the new year unfolds.
Disclaimer: The views and analysis presented in this article are for informational purposes only and reflect the author’s perspective, not financial advice. Technical patterns and indicators discussed are subject to market volatility and may or may not yield the anticipated results. Investors are advised to exercise caution, conduct independent research, and make decisions aligned with their individual risk tolerance.
About Author: Nilesh Hembade is the Founder and Lead Author of Coinsprobe, with over 5 years of experience in the cryptocurrency and blockchain industry. Since launching Coinsprobe in 2023, he has been providing daily, research-driven insights through in-depth market analysis, on-chain data, and technical research.
Disclaimer: The information on this page may come from third parties and does not represent the views or opinions of Gate. The content displayed on this page is for reference only and does not constitute any financial, investment, or legal advice. Gate does not guarantee the accuracy or completeness of the information and shall not be liable for any losses arising from the use of this information. Virtual asset investments carry high risks and are subject to significant price volatility. You may lose all of your invested principal. Please fully understand the relevant risks and make prudent decisions based on your own financial situation and risk tolerance. For details, please refer to
Disclaimer.
Related Articles
Trump Promises a Ceasefire in “2 to 3 Weeks”! Bitcoin Surges Past $69,000, With the “Top 3 Positive Catalysts” Taking the Stage
The Middle East situation has taken a turn, with U.S. President Trump predicting that the U.S.-Iran conflict will be over within 2 to 3 weeks, driving a rebound in global markets. Asian stocks surged to their strongest gains in months, and both the U.S. stock market and the cryptocurrency market also rose. Iran has signaled a willingness to end the conflict; if the UAE were to join the fighting, it could affect oil prices. As market confidence rises, the issuance of crypto ETFs is expected to bring in new capital, further boosting the market outlook.
区块客28m ago
Crypto Market Drops As Fear Grows and Major Assets Decline
The crypto market faces a downturn with a 2.53% drop in market capitalization, led by decreases in Bitcoin and Ethereum prices. However, daily crypto volume rose by 4.26%, while NFT sales surged. Key developments include Genius Group repaying debt and Australia's new crypto policy approval.
BlockChainReporter1h ago
While Bearish Analysts Call For BTC Prices Under $50,000, Bullish Analyst Calls for $200,000 BTC Target
Bearish analysts call for BTC prices under $50,000.
Bullish analyst calls for $200,000 BTC ATH price instead.
Bearish vs bullish expectations continue to clash in new month.
The month of April begins with the same tug of war expectations between a bullish vs bearish crypto market call.
CryptoNewsLand1h ago
Trump vows to “cripple” Iran, with Bitcoin, gold, and U.S. stocks all falling in tandem
After Trump made remarks about the Middle East situation, it led to a sharp drop in Bitcoin, gold, and U.S. stocks. Bitcoin briefly fell to $66,250. Market sentiment was influenced jointly by geopolitical tensions and institutional fund flows, and investors need to be wary of volatility risks.
GateNews1h ago
Market defensive sentiment is intensifying! K33: “Shorting the Bitcoin ETF” positions are approaching a new high
K33’s research report indicates that the Bitcoin market is in a high-alert state due to weak coin prices, geopolitical risks, and threats from quantum computing, leading to a sharp increase in short positions. Vetle Lunde notes that persistently negative funding rates continue to reflect the market being overly crowded, which could signal that a turnaround may be on the way. At the same time, trading volume and volatility typically decline during holidays, affecting market liquidity.
区块客1h ago
Is not buying the biggest risk? Wall Street realizes: Bitcoin’s “this” has completely changed…
Bitcoin’s market structure is steadily maturing; its pullback magnitude has already dropped to about 50%, indicating that it is shifting from a “speculative toy” to a stable asset class. Analysts believe that institutional investors are starting to view Bitcoin as a portfolio optimizer rather than a high-risk wager. Although expected returns may normalize, historical data shows that Bitcoin’s long-term performance still outpaces other assets.
区块客2h ago
