
**Date: **Wed, Jan 07, 2026 | 08:00 AM GMT
The broader cryptocurrency market continues to show strong New Year momentum, with Bitcoin (BTC) up nearly 4% and Ethereum (ETH) posting weekly gains of over 9%. This improving risk sentiment is now extending beyond majors and into select altcoins — including Pudgy Penguins (PENGU).
PENGU has already delivered an impressive 45% gain over the past week. While the rally itself is notable, the more important development lies in the underlying market structure. Recent price behavior on the daily chart suggests that PENGU may be approaching a pivotal breakout zone, one that could define the next directional move.
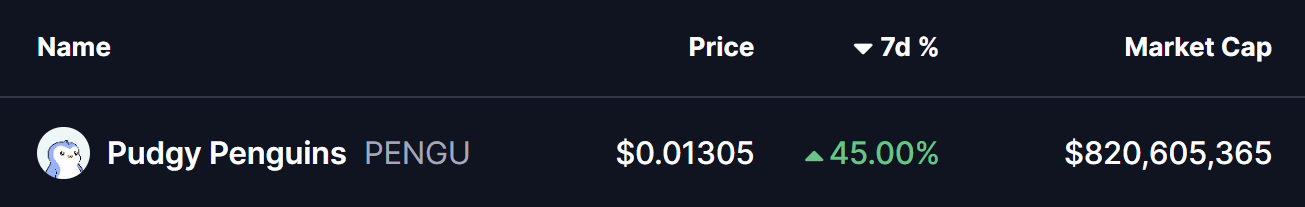
Source: Coinmarketcap
Right-Angled Descending Broadening Pattern in Play
On the daily timeframe, PENGU had been trading within a right-angled descending broadening formation — a bullish reversal pattern characterized by repeated rejections at a flat resistance level and gradually rising downside volatility.
For several weeks, price remained capped beneath the $0.01294–$0.01381 resistance band. Each attempt to push higher was met with selling pressure, keeping PENGU locked in consolidation while the lower boundary of the structure continued to expand.
That dynamic changed after a strong rebound from the lower trendline. Buyers stepped in decisively, triggering a sharp upside move that allowed PENGU to reclaim the 50-day moving average around $0.01062. This level had previously acted as persistent dynamic resistance, and reclaiming it marked a clear shift in short-term momentum.
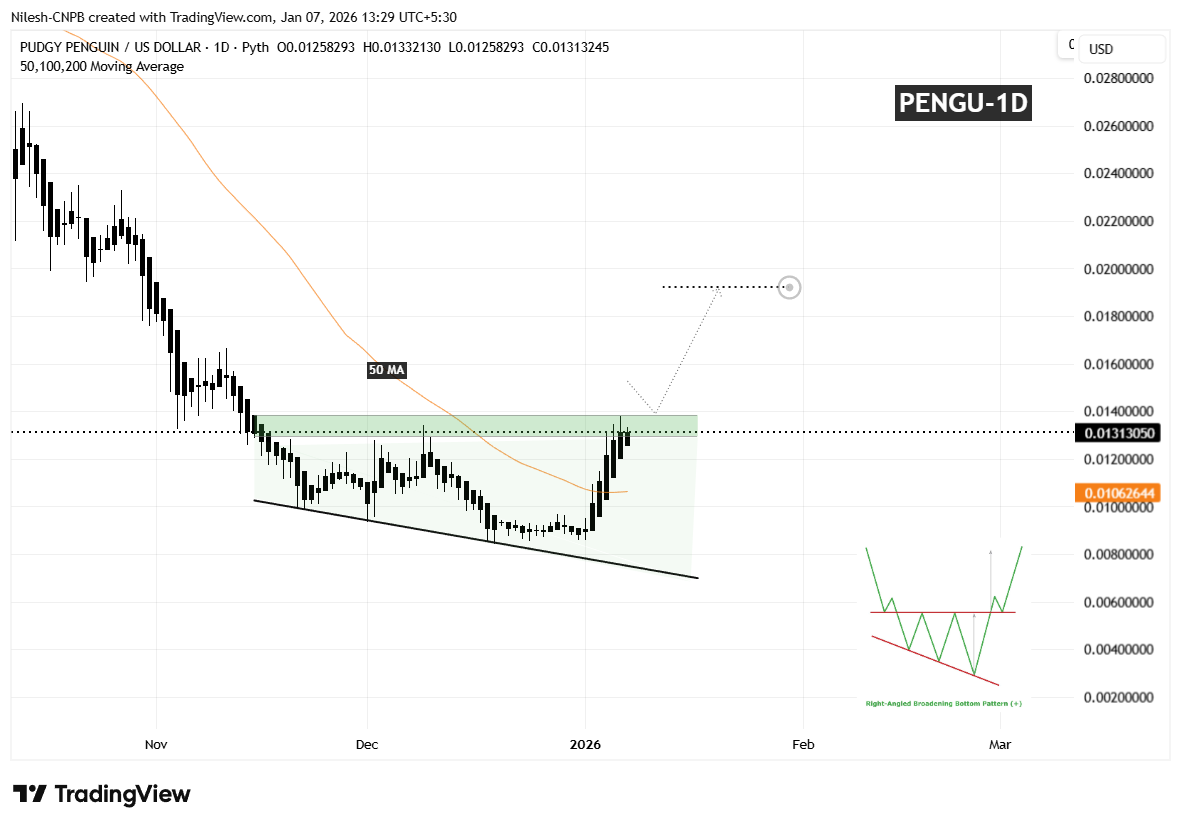
Pudgy Penguins (PENGU) Daily Chart/Coinsprobe (Source: Tradingview)
Following this reclaim, upside strength accelerated, and price has now returned to the same resistance zone that rejected advances multiple times in the past. This move back into resistance places PENGU at a critical inflection point, where market participants are once again being tested.
What’s Next for PENGU?
A decisive daily close above the $0.01294–$0.01381 resistance area would confirm a breakout from the descending broadening formation and validate the broader bullish reversal setup. Sustained acceptance above this zone would likely invite fresh momentum participation, as traders recognize the structural shift underway.
Based on the depth of the pattern and its measured move projection, a successful breakout could open the door toward the $0.01922 region. From current levels, that would represent a potential upside of roughly 45%, aligning with typical expansion behavior seen after clean breakouts from this formation.
That said, patience remains key. Prior to confirmation, PENGU could still experience short-term pullbacks, including a possible retest of the 50-day moving average, which has now transitioned into dynamic support. Such retracements would not invalidate the bullish setup as long as higher-low structures continue to form.
Until a clear breakout and follow-through occur, caution is warranted. The $0.01294–$0.01381 zone remains the defining decision area that will determine whether PENGU transitions into a sustained bullish phase or continues consolidating as the early weeks of 2026 unfold.
Disclaimer: The views and analysis presented in this article are for informational purposes only and reflect the author’s perspective, not financial advice. Technical patterns and indicators discussed are subject to market volatility and may or may not yield the anticipated results. Investors are advised to exercise caution, conduct independent research, and make decisions aligned with their individual risk tolerance.
About Author: Nilesh Hembade is the Founder and Lead Author of Coinsprobe, with over 5 years of experience in the cryptocurrency and blockchain industry. Since launching Coinsprobe in 2023, he has been providing daily, research-driven insights through in-depth market analysis, on-chain data, and technical research.
Disclaimer: The information on this page may come from third parties and does not represent the views or opinions of Gate. The content displayed on this page is for reference only and does not constitute any financial, investment, or legal advice. Gate does not guarantee the accuracy or completeness of the information and shall not be liable for any losses arising from the use of this information. Virtual asset investments carry high risks and are subject to significant price volatility. You may lose all of your invested principal. Please fully understand the relevant risks and make prudent decisions based on your own financial situation and risk tolerance. For details, please refer to
Disclaimer.
Related Articles
BTC 15-minute increase of 0.70%: On-chain capital inflow and market sentiment resonate to drive price movement
From March 10, 2026, 08:00 to 08:15 (UTC), BTC achieved a +0.70% return within 15 minutes, with a price range of 70375.2 to 70926.3 USDT and an amplitude of 0.78%. This short-term fluctuation is significantly higher than the volatility of mainstream coins during the same period, attracting market attention. The increased volatility has prompted investors to closely monitor the market.
The main driver of this fluctuation is large on-chain capital inflows into mainstream trading platforms, with a surge in short-term buying activity. Additionally, some institutional or whale accounts concentrated their positions during the window period, significantly driving the price upward. Meanwhile, market exchanges BTC
GateNews6m ago
JELLYJELLY Contract and Spot Price Discrepancy at 34%, Manipulation Warning Alert Triggered
JELLYJELLY tokens experienced an extreme divergence of 34% between the perpetual contract mark price and the on-chain spot price on March 10, suspected of price manipulation. Analysis shows a surge in open interest and a funding rate reaching -2% every 4 hours, indicating market instability and manipulation risk. Analysts warn investors that this situation could trigger significant price volatility and reflects structural risks during the integration process of decentralized and centralized exchanges.
MarketWhisper20m ago
SHIB Price Drops Despite 53,000% Burn Increase — Understanding the Disconnect
Burn Impact: 172 million SHIB burned reduces supply by 0.00003 percent, too small to move price.
Market Pressure: Bitcoin retreat drags SHIB lower despite burn spike and headlines.
Technical Signals: Price tests $0.00000545 support; break below $0.00000530 could trigger further
CryptoNewsLand43m ago
CPI Data Preview: Bitcoin Approaching $70,000 Key Resistance, Crypto Market May Experience Volatile Fluctuations
As the US CPI data is about to be released, the cryptocurrency market is entering a wait-and-see mode. Bitcoin, after experiencing a correction, is approaching $70,000, and market sentiment has improved, but it faces a short-term key resistance level. CPI data will be the main factor driving short-term market volatility.
GateNews43m ago
Is Bitcoin About to Break Through? Peter Brandt's "Banana Split" Pattern Indicates a Potential Significant Rise in BTC
Senior trader Peter Brant pointed out that Bitcoin is forming a "banana split" chart pattern, indicating potential significant volatility and a breakout from historical price ranges. The recent appearance of the "little banana" may be building momentum for a bull market. He predicts that Bitcoin will experience a price surge by October 2026. Global market sentiment is warming, fueling a 3.2% intraday increase in Bitcoin, currently trading at $69,803. Investors should pay attention to key price ranges to assess market trends.
GateNews56m ago
CRCL stock price increased by 87% in a month, driven by short squeeze and the dual factors of US-Iran conflict
CRCL stock price rose about 10% on March 9, with a total increase of 87.18% over the past month. Mizuho Bank analysts pointed out that this surge was driven by Middle East geopolitical conflicts leading to high oil prices, which boosted inflation expectations and increased the earnings of stablecoin issuers. Another analysis suggests that the stock price increase was mainly due to short covering. Valuation analysis indicates that CRCL's current stock price is above its intrinsic value, posing a risk of overvaluation.
MarketWhisper56m ago