
Date: Fri, Jan 02, 2026 | 06:20 AM GMT
The broader cryptocurrency market has started the new year on a positive note, with both Bitcoin (BTC) and Ethereum (ETH) trading slightly higher and posting gains of over 1%. This modest recovery in major assets has helped stabilize sentiment across the market, allowing several altcoins to attract renewed interest — including the newly listed DEX token, Lighter (LIT).
Following its massive airdrop event, where 25% of the total supply (250 million LIT, valued at approximately $675 million at launch) was distributed, LIT initially faced notable selling pressure. However, price action has remained surprisingly resilient. After absorbing early profit-taking, LIT has stabilized and is now trading with a fresh 7% upside move. More importantly, the lower timeframe technical structure suggests that the token may be positioning itself for a stronger breakout move ahead.
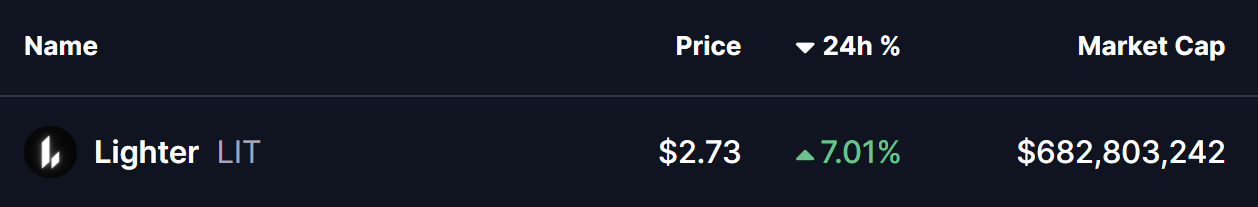
Source: Coinmarketcap
Inverse Head and Shoulders Pattern Signals Bullish Potential
On the 2-hour chart, LIT’s recent price action appears to be forming a classic inverse head and shoulders pattern — a widely followed bullish reversal structure. This formation consists of three distinct dips, with the central decline marking the deepest low, flanked by two higher lows that form the left and right shoulders.
In LIT’s case, the head was established near the $2.34 region, while the left and right shoulders developed around the $2.63–$2.65 zone. This structure highlights a clear shift in momentum, as sellers gradually lose control and buyers step in earlier on each pullback.
The neckline resistance is clearly defined around the $2.82 level, which has been tested multiple times but remains unbroken for now. Each attempt has been met with temporary rejection, yet the inability of price to break back below support suggests growing buying interest beneath the surface.
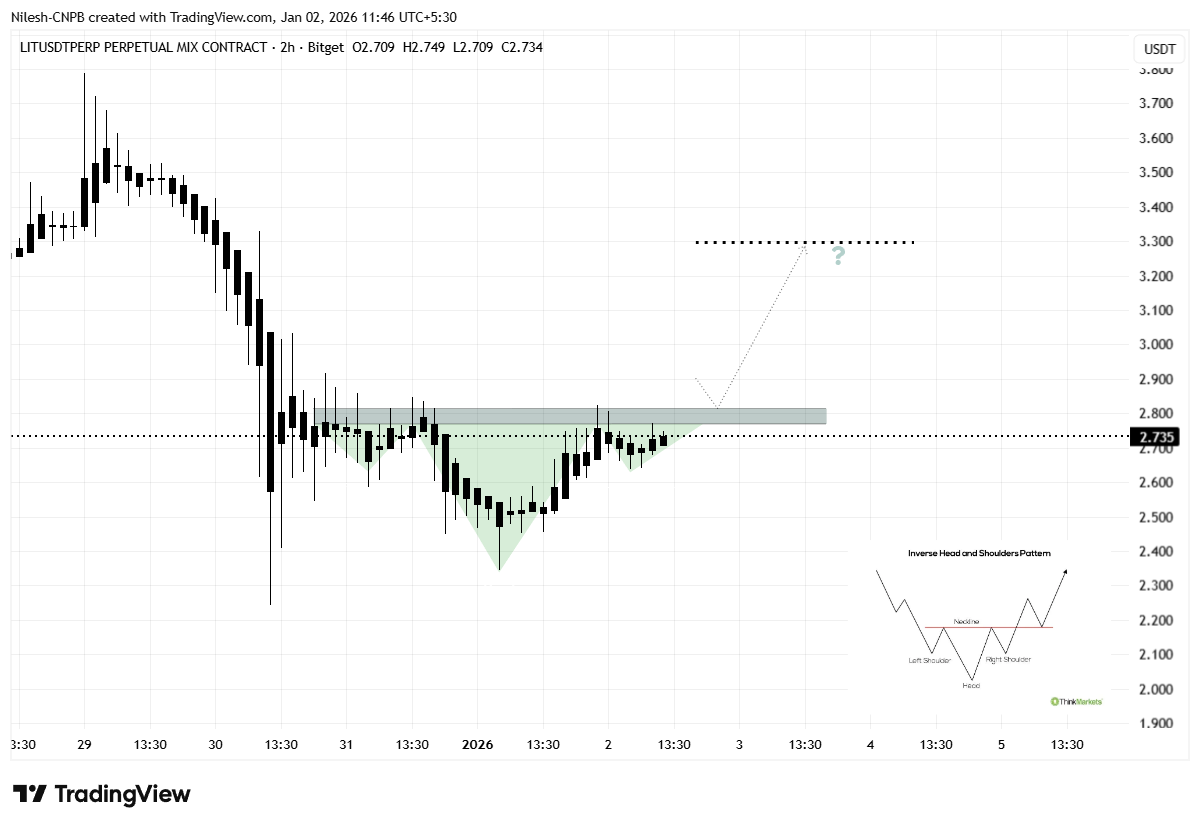
Lighter (LIT) 2H Chart/Coinsprobe (Source: Tradingview)
The most recent rebound from the right shoulder pushed LIT back toward the $2.73 area, keeping price compressed just below the neckline. This tightening price action reflects steady accumulation and reinforces the idea that demand remains firm despite the lack of a confirmed breakout so far.
What’s Ahead for LIT?
From here, LIT appears to be setting up for another challenge of the $2.82 neckline resistance. A decisive breakout above this zone, followed by a sustained close and a successful retest as support, would validate the inverse head and shoulders structure and likely trigger a bullish expansion phase.
Based on the measured move of the pattern, the technical upside projection points toward the $3.29 region. This level represents a potential upside of roughly 20% from current prices and also aligns with prior horizontal resistance, strengthening the bullish outlook if the breakout materializes.
That said, caution remains warranted as this pattern is forming on a lower timeframe. Failure to reclaim and hold above the neckline could result in continued consolidation or a pullback toward the $2.60–$2.65 support region. As long as these higher lows remain intact, the broader bullish structure would stay valid.
For now, the combination of improving market sentiment, strong post-airdrop absorption, and a tightening inverse head and shoulders formation suggests that Lighter is approaching a critical decision point — one that could define its next directional move in the days ahead.
Disclaimer: The views and analysis presented in this article are for informational purposes only and reflect the author’s perspective, not financial advice. Technical patterns and indicators discussed are subject to market volatility and may or may not yield the anticipated results. Investors are advised to exercise caution, conduct independent research, and make decisions aligned with their individual risk tolerance.
About Author: Nilesh Hembade is the Founder and Lead Author of Coinsprobe, with over 5 years of experience in the cryptocurrency and blockchain industry. Since launching Coinsprobe in 2023, he has been providing daily, research-driven insights through in-depth market analysis, on-chain data, and technical research.
Disclaimer: The information on this page may come from third parties and does not represent the views or opinions of Gate. The content displayed on this page is for reference only and does not constitute any financial, investment, or legal advice. Gate does not guarantee the accuracy or completeness of the information and shall not be liable for any losses arising from the use of this information. Virtual asset investments carry high risks and are subject to significant price volatility. You may lose all of your invested principal. Please fully understand the relevant risks and make prudent decisions based on your own financial situation and risk tolerance. For details, please refer to
Disclaimer.
Related Articles
XRP Price Analysis: A death cross overlapping with wavering positions—$1.29 may become the April line between life and death
XRP has been steadily falling within a descending channel since July 2025, dropping about 1.94% in March. Technical indicators show bearish signals, and it may face a larger pullback. Positioning data and the derivatives market also suggest the market is under pressure. Key support is at $1.29; a break below it could point to lower price levels. The current trend depends on improvements in support and capital structure.
GateNews2m ago
Crypto Markets Brace for 4 Key Events This Week, Beginning With Powell on Monday
Following a quiet weekend with little to no actual price moves, bitcoin and the altcoins could be primed for more fluctuations as the business week unfolds due to several big events in the US.
Perhaps the two that are likely to attract the most attention will take place on Monday and
CryptoPotato4m ago
Rising real interest rates are suppressing Bitcoin’s upside potential, and cooling ETF demand and weakening demand are the key variables.
By the end of March 2026, the Bitcoin price is about $67,400. Institutional funding has cooled and high macro interest rates have had an impact, limiting short-term upside momentum. The supply-and-demand structure has loosened, demand has weakened, the market’s ability to absorb has declined, and institutional demand has fallen significantly. Rising real interest rates are increasing liquidity pressure. The market needs to watch for improvements in liquidity and changes in interest rates.
GateNews17m ago
Solana Price Alert: Head-and-Shoulders Top Confirmed Break Below; SOL Could Drop Toward the $73 Key Support Level
Solana (SOL) price remains under pressure, falling about 0.88% in March, and has been trending downward for six consecutive months. The head-and-shoulders top pattern has broken down, pointing to a target of $73, while the key short-term support is around $80. On-chain data shows spot demand is declining, which could intensify sell pressure. Although long-term holders are adding to their positions to provide some support, it may not be enough to help the rebound—market conditions remain tough.
GateNews20m ago
