
As the new year 2026 begins, the broader cryptocurrency market has shown modest strength over the past few hours, with both Bitcoin (BTC) and Ethereum (ETH) turning slightly green. This improvement in sentiment has started to spill over into the altcoin market as well, with several tokens attempting to build upward momentum — including Render (RENDER).
RENDER is currently up around 4% on the day, but the more compelling development lies beneath the surface. On lower timeframes, price action is beginning to highlight a constructive bullish structure that could soon pave the way for a meaningful breakout if confirmed.
Source: Coinmarketcap
Ascending Triangle Structure Takes Shape
On the 4-hour chart, RENDER appears to be forming a textbook ascending triangle, characterized by a sequence of higher lows pressing steadily against a well-defined horizontal resistance zone. This structure is widely viewed as a bullish continuation pattern, particularly when it develops after a period of consolidation and shows signs of accumulation.
RENDER recently faced rejection near the $1.36 neckline resistance, which pushed price back toward its rising support trendline around the $1.28 region. However, each pullback has been met with strong buying interest, keeping the pattern intact and preventing any deeper breakdown. This behavior suggests that sellers are gradually losing control as buyers continue to step in at higher levels.
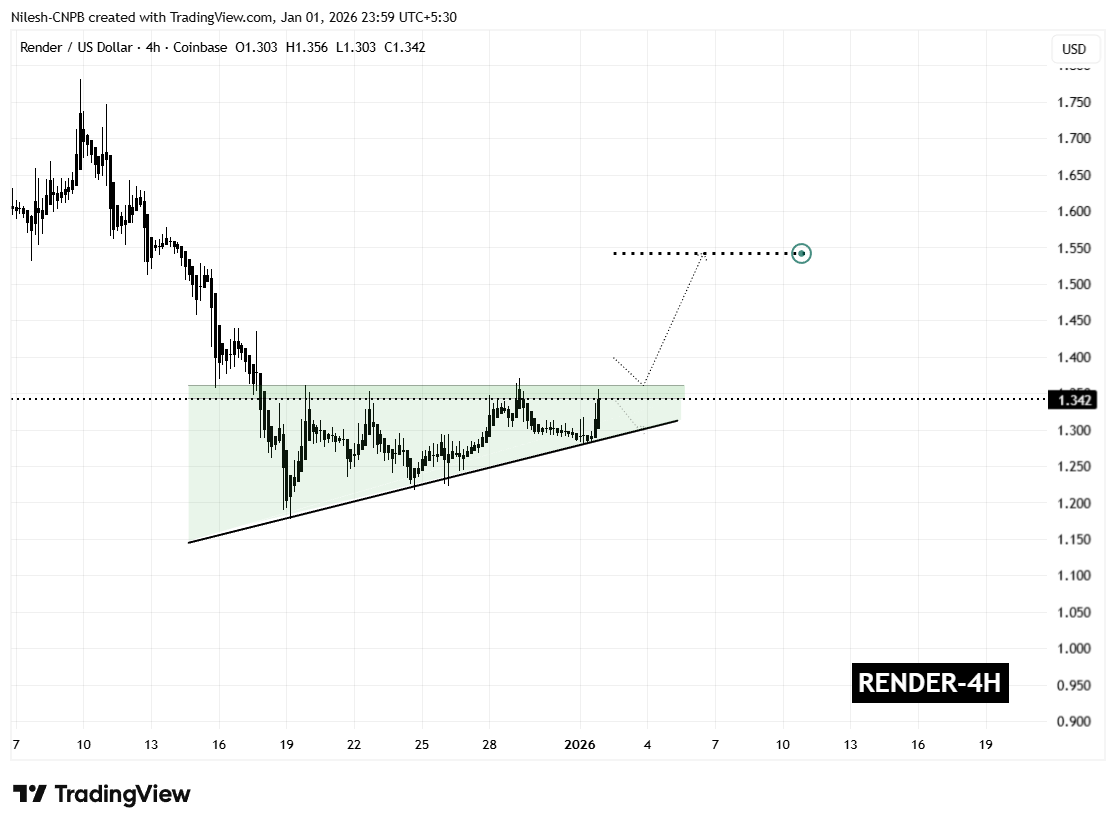
Render (RENDER) 4H Chart/Coinsprobe (Source: Tradingview)
The latest rebound has carried RENDER back toward the upper boundary of the pattern, reinforcing the idea that demand remains firm. Rather than signaling weakness, this price action points to healthy consolidation as the market tightens ahead of a potential breakout.
What’s Next for RENDER?
From here, RENDER appears to be preparing for another test of the $1.36 resistance zone. A confirmed breakout and sustained close above this level, ideally followed by a successful retest as support, would validate the ascending triangle structure and likely trigger a bullish expansion phase.
Based on the measured move of the pattern, the technical upside projection points toward the $1.54 region. This target represents a potential upside of roughly 14% from current levels and also aligns with previous price structure, strengthening the bullish case.
That said, caution remains warranted. A failure to break above resistance could result in a pullback toward the rising support trendline. As long as that trendline continues to hold, the broader bullish structure would remain intact. A decisive breakdown below support, however, would invalidate the pattern and delay any breakout scenario.
For now, the combination of improving market sentiment, persistent buying pressure, and a tightening ascending triangle structure suggests that Render is approaching a critical decision point — one that could define its next significant move as 2026 gets underway.
Disclaimer: The views and analysis presented in this article are for informational purposes only and reflect the author’s perspective, not financial advice. Technical patterns and indicators discussed are subject to market volatility and may or may not yield the anticipated results. Investors are advised to exercise caution, conduct independent research, and make decisions aligned with their individual risk tolerance.
About Author: Nilesh Hembade is the Founder and Lead Author of Coinsprobe, with over 5 years of experience in the cryptocurrency and blockchain industry. Since launching Coinsprobe in 2023, he has been providing daily, research-driven insights through in-depth market analysis, on-chain data, and technical research.
Disclaimer: The information on this page may come from third parties and does not represent the views or opinions of Gate. The content displayed on this page is for reference only and does not constitute any financial, investment, or legal advice. Gate does not guarantee the accuracy or completeness of the information and shall not be liable for any losses arising from the use of this information. Virtual asset investments carry high risks and are subject to significant price volatility. You may lose all of your invested principal. Please fully understand the relevant risks and make prudent decisions based on your own financial situation and risk tolerance. For details, please refer to
Disclaimer.
Related Articles
Solana Reclaims $90 as Golden Cross Signals Renewed Momentum
Solana has surpassed the $90 resistance, aided by a golden cross indicating positive momentum, despite low trading volume. Strong on-chain growth supports price stability, and sustained support above $89.50 could push Solana towards $96, though higher volume is crucial for confirming a breakout.
CryptoNewsLand24m ago
Hyperliquid Gains Traction as ETF Push Meets Strong Momentum
Key Insights:
Grayscale ETF filing has increased institutional visibility for HYPEUSD, strengthening demand expectations as traditional investors seek simplified exposure to the Hyperliquid ecosystem.
Technical indicators show
CryptoNewsLand29m ago
Cardano Faces $9.9M Liquidation Risk as ADA Hovers Near Key Support
Cardano is currently trading near $0.264, facing potential liquidation risks if it drops to $0.253. While on-chain data indicate reduced realized losses, the market remains in a distribution phase, hindering recovery. Resistance challenges persist between $0.2856 and $0.300, necessitating a stronger rally for upside movement.
CryptoFrontNews54m ago
Bittensor Jumps 20% After Jensen Huang Backs Distributed AI
Key Insights:
Bittensor surged over 20% after NVIDIA CEO Jensen Huang highlighted its distributed AI training, drawing strong attention from both crypto and technology markets.
The TAO price broke above the Bull Market Support Band for the first time since November, signaling a potential
CryptoNewsLand1h ago
Zcash Holds Key Support After 18% Drop From Weekly Peak
Key Insights:
The Zcash price dropped over 18% to $232, now testing a key trendline support that may determine short-term direction and potential recovery strength.
Bullish RSI divergence and a green Supertrend suggest weakening selling pressure, with upside targets at $265 and $300 if suppo
CryptoNewsLand1h ago
Did we win or lose the war? Trump: We profited.
Although it is difficult to evaluate his presidential abilities, Trump has demonstrated outstanding performance in manipulating financial markets. He uses his statements to influence market fluctuations, causing large amounts of capital to flow in and out, revealing a combination of his trading skills and political strategies. By shaping the stock market performance to gain political benefits while avoiding legal risks associated with direct profits, he navigates skillfully between power and wealth.
金色财经_1h ago
