
Silence has a way of telling a story in crypto. Artificial Superintelligence Alliance (FET) price has quietly drifted back into a part of the chart that rarely gets attention while it is happening. This is the same area where past rallies were born, not through hype or headlines, but through patience and time. The weekly chart now shows FET sitting inside a familiar base, and the calm itself is what makes this moment interesting.
Flippix has been tracking this zone closely, pointing out that this is where momentum fades, volume dries up, and expectations drop. History suggests that these quiet stretches tend to matter more than the loud breakouts that follow.
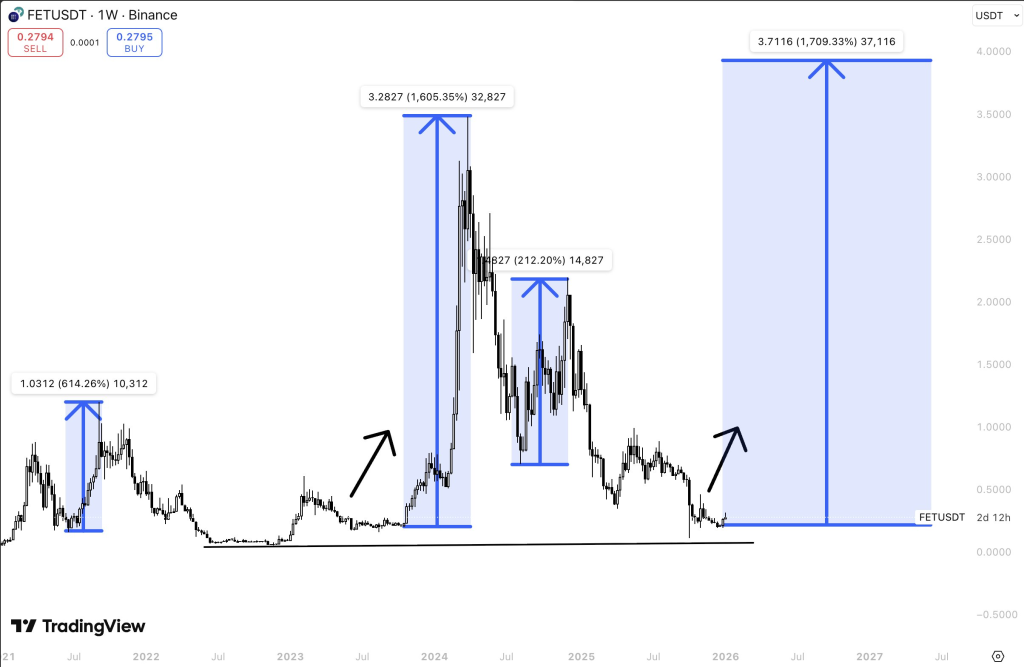
Artificial Superintelligence Alliance has seen this structure before. The attached weekly chart highlights several periods where FET price moved sideways near long-term support. Each time, price action looked uneventful and even boring on the surface. Sellers pushed, buyers absorbed, and volatility slowly disappeared.
The chart shows how previous rallies did not start from strength or excitement. Each major expansion began after long compression near the lows. FET spent weeks and sometimes months hovering close to the same price zone before suddenly expanding upward. That pattern is visible again, with price pressing into a familiar range that previously acted as a launchpad.
@Flippix_sol / X
Flippix describes this phase as absorption. Selling pressure gradually exhausts itself while stronger hands accumulate quietly. The chart visually supports that idea, showing extended flat trading before sharp vertical moves in past cycles.
- FET Price Compression Signals A Shift In Market Behavior
- Why Holding This Range Matters More Than Breakout Candles
- Historical FET Moves Show Quiet Periods Came Before Explosive Runs
FET Price Compression Signals A Shift In Market Behavior
FET price action right now looks restrained rather than weak. Volatility has faded and price swings have narrowed, especially when viewed on the weekly timeframe. This kind of compression tends to appear when the market has already processed prior moves and selling interest begins to thin out.
Flippix emphasizes that this zone was never about instant pumps. Previous cycles followed a similar rhythm, starting with a slow grind near the base, followed by a sudden expansion once sellers were fully exhausted. The chart shows those transitions clearly, with long quiet stretches preceding sharp upside moves that unfolded quickly.
This behavior explains why the current price action may feel uninteresting. That lack of excitement is often what allows structural strength to build without interruption.
Why Holding This Range Matters More Than Breakout Candles
Artificial Superintelligence Alliance does not need dramatic candles to make this zone meaningful. Flippix notes that the key signal is whether FET keeps holding this range without bleeding lower. As long as price stays defended near the base, downside risk gradually shrinks.
The chart illustrates how past failures came from losing these support zones decisively. Successful cycles, by contrast, showed price respecting the range and refusing to break down further. Once that stability was established, upside asymmetry quietly increased.
This perspective shifts attention away from chasing breakouts and toward observing behavior within the range itself. Stability, not speed, has historically been the trigger.
Hedera (HBAR) Price to $5 Sounds Unreal Until You Do the Math_**
Historical FET Moves Show Quiet Periods Came Before Explosive Runs
Looking back across the chart, each major FET rally followed the same script. Price spent time near the lows, participation thinned out, and attention moved elsewhere. That environment allowed accumulation to take place without competition.
Flippix highlights that nothing exciting happened during those phases. The excitement arrived later, once the structure was complete and sellers had stepped aside. The current setup mirrors those earlier moments closely, with price sitting in a zone that previously led to gains exceeding $1, $3, and beyond during earlier cycles.
The repetition of this behavior is what makes the present setup stand out, even without any immediate confirmation.
FET price now sits at a point where history whispers rather than shouts. Artificial Superintelligence Alliance has been here before, and the chart shows how patience was rewarded in past cycles. Curiosity naturally builds when familiar patterns return, especially when the market feels quiet again.
Disclaimer: The information on this page may come from third parties and does not represent the views or opinions of Gate. The content displayed on this page is for reference only and does not constitute any financial, investment, or legal advice. Gate does not guarantee the accuracy or completeness of the information and shall not be liable for any losses arising from the use of this information. Virtual asset investments carry high risks and are subject to significant price volatility. You may lose all of your invested principal. Please fully understand the relevant risks and make prudent decisions based on your own financial situation and risk tolerance. For details, please refer to
Disclaimer.
Related Articles
XRP Rises 4% as Ripple Partnership and ETF Inflows Drive Recovery
XRP rose 4% to $1.41, boosted by Ripple's partnership with Kyobo Life and increasing institutional interest. Broader market gains and positive community engagement also contributed, though XRP remains 63% below its peak. Key support is at $1.38.
GateNews43m ago
ETH/BTC ratio rebounds—are institutional funds rotating? A deep dive into structural signals in the crypto market
BTC breaks through $75,000; the Iran–Israel ceasefire and fresh highs in U.S. stocks lift risk assets, but the options market remains somewhat cautious. The ETH/BTC ratio rebounds, signaling capital rotation.
GateInstantTrends1h ago
Crypto Market Rebounds 1.5% to $2.54T as Bitcoin Leads Rally Amid Tech Surge and Policy Progress
The crypto market rebounded 1.5% to $2.54 trillion, led by Bitcoin's 7% gain amid easing geopolitical tensions and strong ETF inflows. Analysts predict further gains if Bitcoin surpasses $76K resistance.
GateNews2h ago
Bitcoin bull market index rises to 40 points; Bloomberg: the U.S. and Iran are considering extending the ceasefire agreement by two weeks
Bitcoin’s price as of April 16 is approaching $74,700. The Bullish Sentiment Index (BSI) has risen to 40 points, indicating a rebound in market sentiment. The United States and Iran are evaluating options to extend the current ceasefire agreement, and they are also discussing navigation issues in the Strait of Hormuz, as diplomatic negotiations continue.
MarketWhisper7h ago
Bitcoin holds steady at 74K, and FOMO sentiment is heating up as U.S. stocks hit a record high
Benefiting from positive news about the U.S.-Iran peace agreement, the stock market surged sharply, with the Nasdaq index and the S&P 500 index reaching record highs. Bitcoin remained steady at 74K, market sentiment improved, and the Fear & Greed Index rose to 55. Investor FOMO toward the stock market intensified, and the total market capitalization in the crypto market increased overall, indicating genuine buy-side interest.
ChainNewsAbmedia9h ago
