
Key Takeaways
-
Aster (ASTER) has hit a new all-time low near $0.54 amid a broader crypto market sell-off.
-
The current price structure closely mirrors Hyperliquid (HYPE)’s 2025 bottoming fractal, which preceded a 200%+ rally.
-
ASTER is forming a potential rounding bottom after a ~77% drawdown from its peak.
-
A reclaim of the 50-day moving average near $0.79 could signal early trend reversal.
-
The activation of ASTER’s Strategic Buyback Reserve may help stabilize price and reduce circulating supply.
As of January 19, 2026, Aster (ASTER) is under heavy pressure, printing a fresh all-time low at $0.5420. The sharp drop comes amid a broader market sell-off triggered by escalating US–EU trade tensions, which wiped out nearly $875 million in leveraged long positions across crypto. Bitcoin (BTC) and Ethereum (ETH) are both down 2–3% on the day, and smaller-cap tokens like ASTER have taken the brunt of the impact.
ASTER has now fallen more than 12% in the past 24 hours, but beneath the surface, the price structure is beginning to tell a more nuanced story. Interestingly, the current setup closely resembles the bottoming fractal previously seen in Hyperliquid (HYPE) — a structure that ultimately preceded a powerful upside reversal.
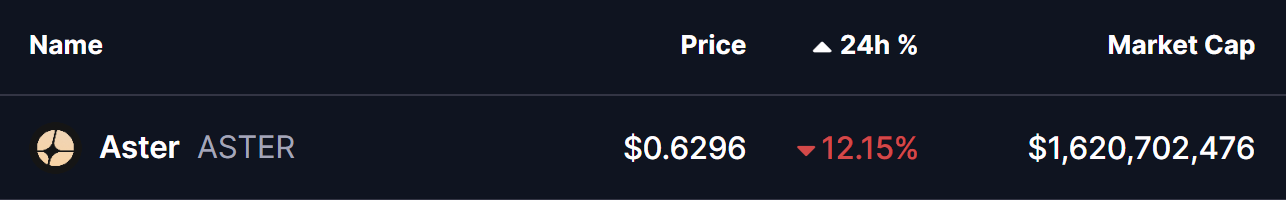
Source: Coinmarketcap
ASTER Mirrors HYPE’s Bottoming Path
A closer look at the comparative chart reveals striking similarities between ASTER’s current price action and HYPE’s April 2025 bottoming phase.
HYPE’s move started with a sharp correction following its all-time high. Price slipped below the 50-day moving average, signaling a momentum shift. Instead of continuing lower aggressively, HYPE entered a rounding bottom structure, reflecting gradual seller exhaustion. The final low came after a deep 73% drawdown from the peak, marking a clear inflection point in market sentiment.
What followed was critical. HYPE reclaimed both the 50-day and 100-day moving averages, confirming a trend shift. That technical reclaim ignited a breakout from the rounding base, leading to a 207% rally — one of HYPE’s most notable reversals of 2025.
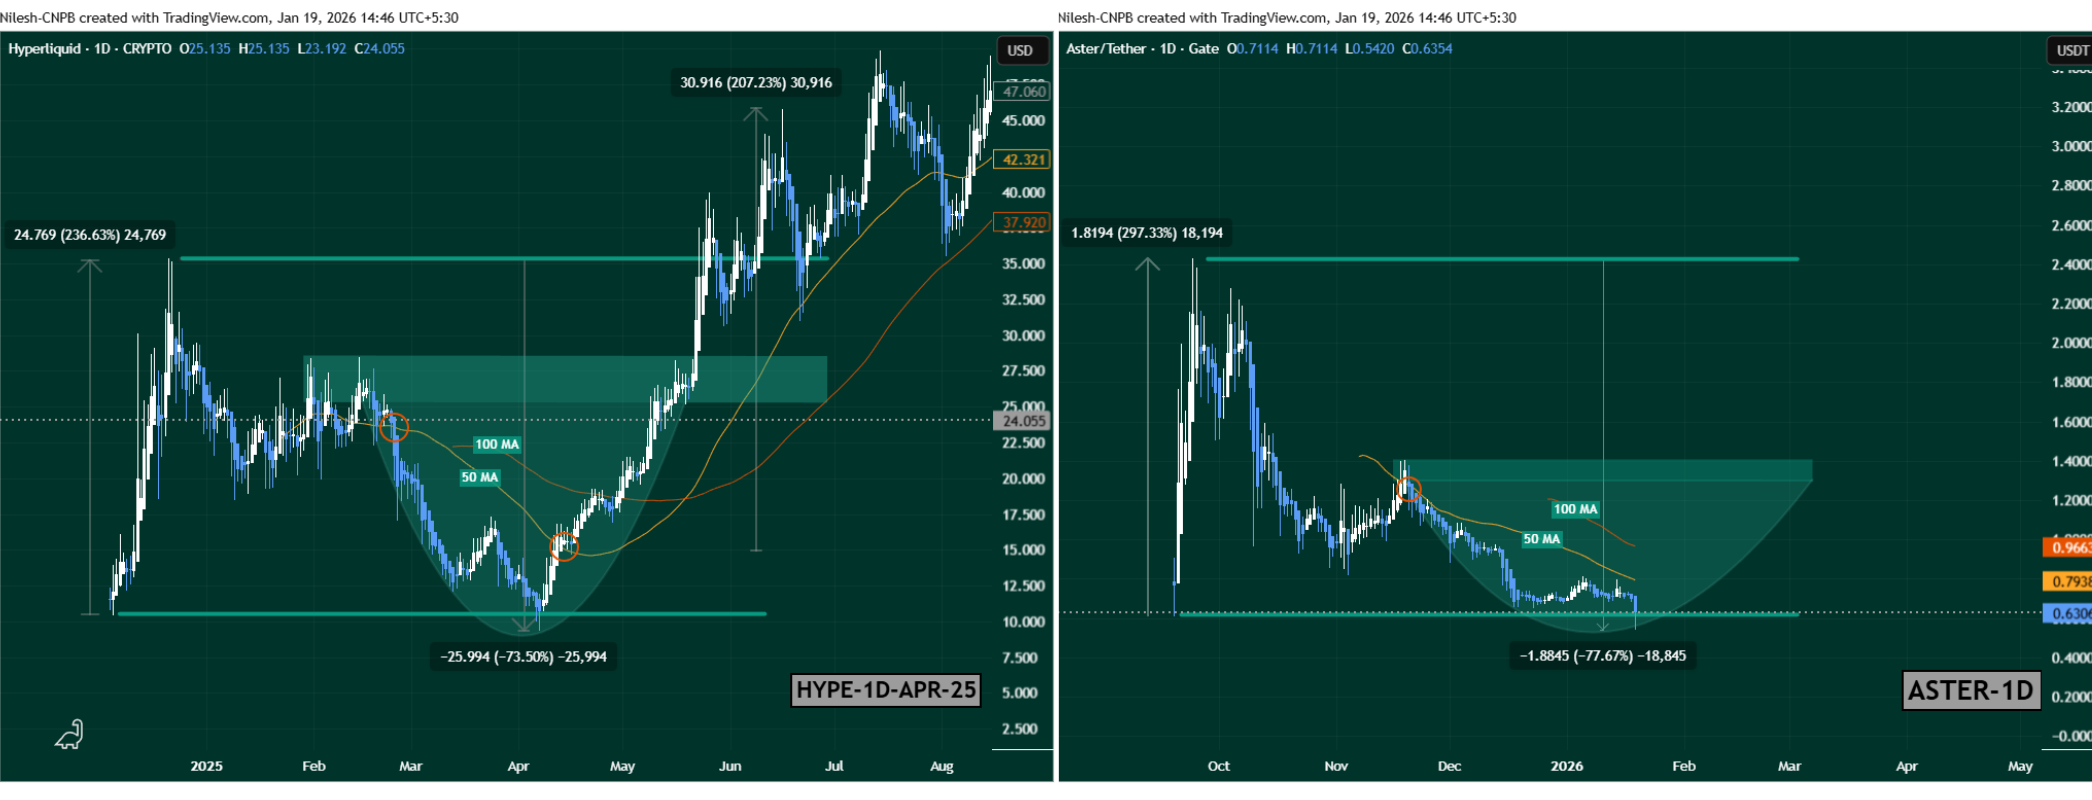
HYPE and ASTER Fractal Chart/Coinsprobe (Source: Tradingview)
ASTER now appears to be walking a similar road.
After topping near its all-time high around $2.42, ASTER entered a prolonged corrective phase and lost its 50-day moving average. Price has since been carving out what looks like a rounding bottom, with today’s low near $0.54, representing a steep 77% drawdown from the top. The structure, momentum loss, and gradual flattening strongly resemble HYPE’s pre-reversal behavior highlighted in the fractal comparison.
What’s Next for ASTER?
If this fractal continues to unfold, ASTER may be approaching a critical inflection point.
From a bullish perspective, the first key confirmation would be a reclaim of the 50-day moving average, currently sitting near $0.7983. A sustained move above this level would signal weakening bearish momentum and growing buyer confidence.
Beyond that, the major level to watch lies at the neckline resistance near $1.4066. A clean breakout above this zone could shift ASTER into a broader recovery phase, potentially mirroring the type of upside expansion HYPE experienced once its reversal was confirmed.
Adding to the constructive backdrop, Aster activated its Strategic Buyback Reserve today. The protocol is now automatically repurchasing $ASTER using 20–40% of daily platform fees, expanding its Stage 5 buyback program launched in December 2025. These buybacks are on-chain verifiable, dynamically adjusted based on market conditions, and designed to gradually reduce circulating supply. Notably, early buyback activity is already visible on-chain, and the timing coincides with ASTER printing fresh lows — a move widely viewed as a stabilization effort.
Key Risk Note
While fractal similarities can provide valuable context, they are not guarantees. Market conditions, liquidity profiles, and sentiment can vary significantly between assets and cycles. ASTER still needs confirmation through moving average reclaims and follow-through buying. A failure to hold current support zones would weaken the bottoming thesis and open the door to further downside.
Bottom Line
ASTER appears to be approaching a make-or-break zone. The emerging rounding bottom, historical fractal similarity to HYPE, and the launch of an active buyback mechanism all point toward a potential shift in momentum. Whether this structure evolves into a confirmed bottom or turns into another pause before continuation lower will depend on how price reacts around the 50-day moving average and key resistance levels in the days ahead.
Disclaimer: The views and analysis presented in this article are for informational purposes only and reflect the author’s perspective, not financial advice. Technical patterns and indicators discussed are subject to market volatility and may or may not yield the anticipated results. Investors are advised to exercise caution, conduct independent research, and make decisions aligned with their individual risk tolerance.
About Author: Nilesh Hembade is the Founder and Lead Author of Coinsprobe, with over 5 years of experience in the cryptocurrency and blockchain industry. Since launching Coinsprobe in 2023, he has been providing daily, research-driven insights through in-depth market analysis, on-chain data, and technical research.
Disclaimer: The information on this page may come from third parties and does not represent the views or opinions of Gate. The content displayed on this page is for reference only and does not constitute any financial, investment, or legal advice. Gate does not guarantee the accuracy or completeness of the information and shall not be liable for any losses arising from the use of this information. Virtual asset investments carry high risks and are subject to significant price volatility. You may lose all of your invested principal. Please fully understand the relevant risks and make prudent decisions based on your own financial situation and risk tolerance. For details, please refer to
Disclaimer.
Related Articles
Bitcoin jolted modestly higher on Iran ceasefire report; oil tumbles 4%
The crypto market experienced a slight recovery following news of a potential one-month ceasefire in negotiations involving U.S. envoys. This led to a drop in oil prices and a brief rise in Bitcoin, with U.S. stock futures also gaining.
CoinDesk58m ago
BlackRock sees AI driving crypto’s next bull phase as altcoin interest fades
Robbie Mitchnick from BlackRock highlighted a shift in crypto investment focus, emphasizing AI's growing importance over new tokens. Investors are concentrating on established assets like Bitcoin and Ethereum, with AI seen as a key driver influencing crypto's future and potential as infrastructure.
CoinDesk1h ago
Shiba Inu Burn Rate Jumps 370% as SHIB Breaks Key Level
Key Insights:
The Shiba Inu burn rate surged over 370% in 24 hours, removing more than 4.2 million tokens and reducing the overall circulating supply significantly.
SHIB price climbed above a key resistance level while forming higher lows, indicating steady accumulation despite declining
CryptoNewsLand2h ago
Solana Reclaims $90 as Golden Cross Signals Renewed Momentum
Solana has surpassed the $90 resistance, aided by a golden cross indicating positive momentum, despite low trading volume. Strong on-chain growth supports price stability, and sustained support above $89.50 could push Solana towards $96, though higher volume is crucial for confirming a breakout.
CryptoNewsLand2h ago
Hyperliquid Gains Traction as ETF Push Meets Strong Momentum
Key Insights:
Grayscale ETF filing has increased institutional visibility for HYPEUSD, strengthening demand expectations as traditional investors seek simplified exposure to the Hyperliquid ecosystem.
Technical indicators show
CryptoNewsLand2h ago
Cardano Faces $9.9M Liquidation Risk as ADA Hovers Near Key Support
Cardano is currently trading near $0.264, facing potential liquidation risks if it drops to $0.253. While on-chain data indicate reduced realized losses, the market remains in a distribution phase, hindering recovery. Resistance challenges persist between $0.2856 and $0.300, necessitating a stronger rally for upside movement.
CryptoFrontNews2h ago
