
Key Takeaways
-
OriginTrail (TRAC) has surged around 12% in a single day, drawing renewed attention to the token.
-
TRAC has broken out from an ascending triangle near $0.46 on the daily chart, signaling growing bullish momentum.
-
Similar breakout structures in July and October 2025 previously led to strong rallies of 63% and 113%.
-
Holding the $0.44–$0.46 zone as support will be crucial to keep the bullish fractal setup intact.
-
If the pattern plays out, TRAC could attempt a move toward its long-term ascending resistance above $1.00.
OriginTrail, the decentralized knowledge graph protocol, is stepping back into the spotlight as its native token TRAC records a strong 12% daily surge. Beyond the price jump, the real signal is coming from the charts, where a familiar fractal breakout structure is starting to emerge on the daily timeframe, hinting that a larger upside move could be forming.
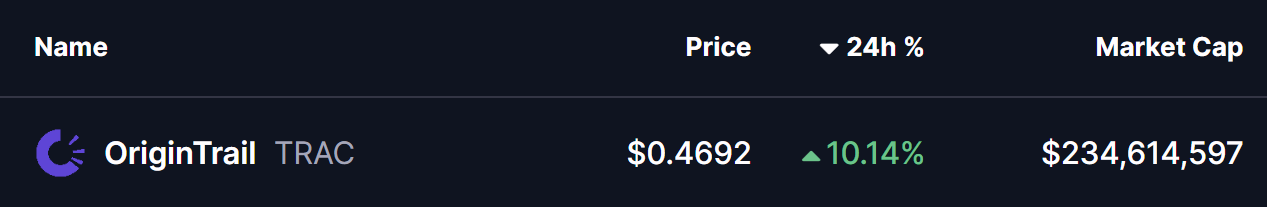
Source: Coinmarketcap
Fractal Breakout Hints at Potential Upside Move
On the daily chart, TRAC has confirmed a breakout from an ascending triangle pattern near the $0.46 level. This breakout is particularly important as price is now trading just above the 200-day moving average, a level that has historically acted as a major trend-defining zone for TRAC.
What makes this setup more compelling is its similarity to previous breakout phases. In late July 2025, a comparable structure resulted in a 63% upside move after price held above its breakout base. Later, in early October 2025, TRAC broke out from a right-angled descending broadening wedge pattern. That move was followed by a reclaim of the 200-day moving average and ultimately led to a powerful 113% rally.
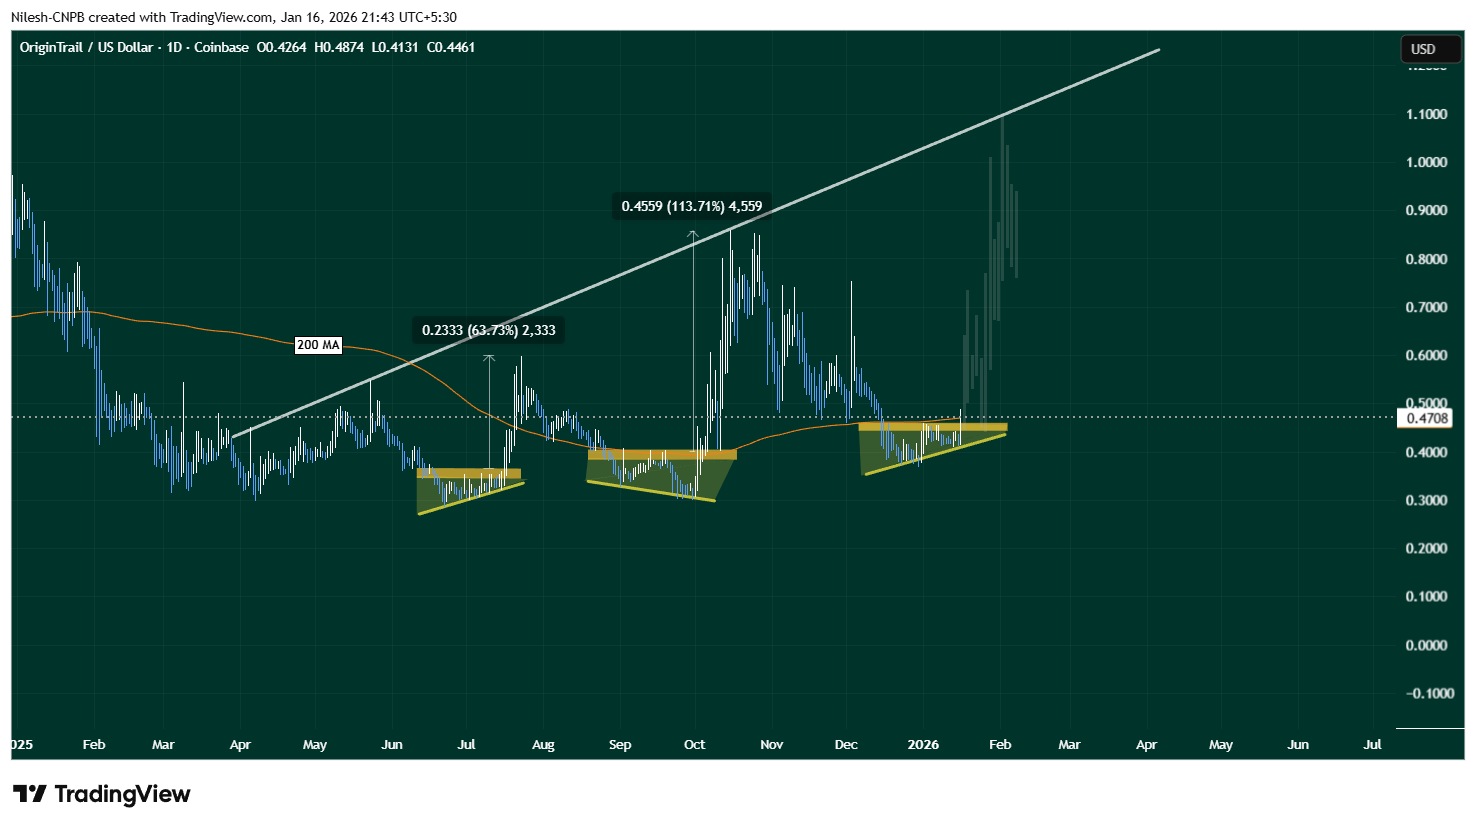
OriginTrail (TRAC) Daily Chart/Coinsprobe (Source: Tradingview)
The current setup shares key characteristics with those earlier moves. Price compression, a clean breakout, and interaction with the 200-day MA suggest that TRAC may once again be transitioning from consolidation into expansion.
What’s Next for TRAC?
If this fractal breakout plays out as expected, holding the $0.44–$0.46 zone as support will be crucial. A sustained hold above this range, along with continued strength above the 200-day moving average, could act as a launchpad for further upside.
In that scenario, TRAC may attempt a move toward its long-term ascending resistance trendline, which currently sits above the $1.00 level. A push toward that zone would align closely with the magnitude of prior fractal-driven rallies seen on the chart.
That said, fractal patterns are never guarantees. Broader market conditions, liquidity, and overall sentiment will continue to influence price action. A failure to hold the $0.44–$0.46 support zone or a rejection back below the 200-day moving average could invalidate the breakout and weaken the bullish fractal thesis.
Bottom Line
TRAC is showing early signs of another technically significant breakout, supported by historical fractal behavior and a reclaim of a key long-term moving average. If buyers can defend the current support zone, the chart suggests that OriginTrail may be positioning itself for a larger upside move in the weeks ahead.
Disclaimer: The views and analysis presented in this article are for informational purposes only and reflect the author’s perspective, not financial advice. Technical patterns and indicators discussed are subject to market volatility and may or may not yield the anticipated results. Investors are advised to exercise caution, conduct independent research, and make decisions aligned with their individual risk tolerance.
About Author: Nilesh Hembade is the Founder and Lead Author of Coinsprobe, with over 5 years of experience in the cryptocurrency and blockchain industry. Since launching Coinsprobe in 2023, he has been providing daily, research-driven insights through in-depth market analysis, on-chain data, and technical research.
Disclaimer: The information on this page may come from third parties and does not represent the views or opinions of Gate. The content displayed on this page is for reference only and does not constitute any financial, investment, or legal advice. Gate does not guarantee the accuracy or completeness of the information and shall not be liable for any losses arising from the use of this information. Virtual asset investments carry high risks and are subject to significant price volatility. You may lose all of your invested principal. Please fully understand the relevant risks and make prudent decisions based on your own financial situation and risk tolerance. For details, please refer to
Disclaimer.
Related Articles
JPMorgan: Bitcoin absorbs Iran war hedge funds, gold ETF experiences significant outflows
JPMorgan report indicates that due to the Iran conflict, Bitcoin outperformed gold and silver, the latter of which experienced significant declines due to rising interest rates and a strong dollar. Gold's high-position holdings were forcibly liquidated under market pressure, leading to capital outflows. Bitcoin remained stable, demonstrating its appeal as a safe-haven asset, especially amid geopolitical tensions. The report also emphasizes that Bitcoin's market liquidity has surpassed gold, indicating an improvement in its structural position.
MarketWhisper20m ago
Why did Bitcoin drop today? Trump extends Iran ceasefire period by 10 days, negotiations face disagreements.
U.S. President Trump extends the ceasefire period with Iran until April 6, but Iranian officials deny the request, leading to continued market pessimism about the prospects of negotiations. As the U.S. 10-year Treasury yield rises to 4.42%, the attractiveness of high-risk assets like Bitcoin diminishes, preventing a rebound and instead continuing to face selling pressure. The market is sensitive to liquidity conditions, and in the short term, attention should be paid to the direction of yields and spot demand.
MarketWhisper25m ago
Today, the cryptocurrency Fear & Greed Index rose to 13, indicating extreme fear in the market.
Gate News reports that on March 27, data from Alternative.me shows that today’s cryptocurrency Fear and Greed Index has risen to 13, indicating the market is in a state of "extreme fear." Yesterday, the index was 10, also in the "extreme fear" zone.
GateNews51m ago
23.91% Plunge for KMD: What It Means for Traders
KMD has seen a significant decline, trading at $0.005324 after dropping 54.20% in 24 hours. Increased market activity and liquidation events in the derivatives market are contributing to the volatility, prompting traders to focus on risk management.
Coinfomania1h ago
MemeCore Price Volatility Explodes After Hardfork and Perp Listing Surge - BTC Hunts
The post MemeCore Price Volatility Explodes After Hardfork and Perp Listing Surge appeared first on Coinpedia Fintech News
MemeCore price just pulled off one of those blink-and-you-miss-it moves. A brutal 65% intraday surge sent the token flying from $1.70 to $2.80 only to slam straight into a
BTCHUNTS1h ago
The situation in the US-Iran war worsens, oil prices rise by 4%, and the surge in US Treasury yields impacts US stocks, causing them to fall.
Due to the worsening Middle East situation and soaring U.S. Treasury yields, concerns about inflation have intensified, causing the U.S. stock market to retreat and turning the sentiment cautious. Energy stocks rose against the trend, and crude oil prices broke through $100 per barrel, further fueling market panic. U.S. import prices experienced their largest increase since 2022, and postal services raised fuel surcharges, drawing attention to the consumer confidence index. The Federal Reserve chair succession process has stalled amid political disputes, and the cryptocurrency market remains flat as investors stay on the sidelines.
ChainNewsAbmedia2h ago
