- Mog Coin currently trades at $0.0000002405.
- MOG’s daily trading volume has reached $6.85M.
The broader crypto market sentiment is fear again, but both red and green charts are found across the digital assets. Meanwhile, the meme coin market cap is settled at $43.60 billion, after a 2.7% spike. Among the tokens, the Mog Coin (MOG) price has registered a modest gain of over 2.96% in the last 24 hours
The meme coin kicked off the day, trading at a low of $0.0000002322, and with the brief bullish recovery, a move to the upside was initiated toward a high range of $0.0000002453. At the time of writing, Mog Coin trades at around $0.0000002405, and its daily trading volume has reached the $6.85 million mark
The recent trading window of Mog Coin reports a downtrend, and the price could retrace to its crucial support below $0.0000002390. If the bears gained more traction, the price action would continue to lose strength and fall even lower. Conversely, if the price trajectory flips to the bullish side, the Mog Coin price might climb toward the resistance level above the $0.0000002420 range. Further pressure on the upside triggers the bulls to move higher
Technicals Hint at Mog Coin Struggle: Bears in Control
Mog Coin’s Moving Average Convergence Divergence (MACD) line and the signal line are positioned below the zero line, which implies a bearish shift. Also, the short-term trend is weaker than the long-term trend. As long as they remain below zero, the upside moves will face resistance.
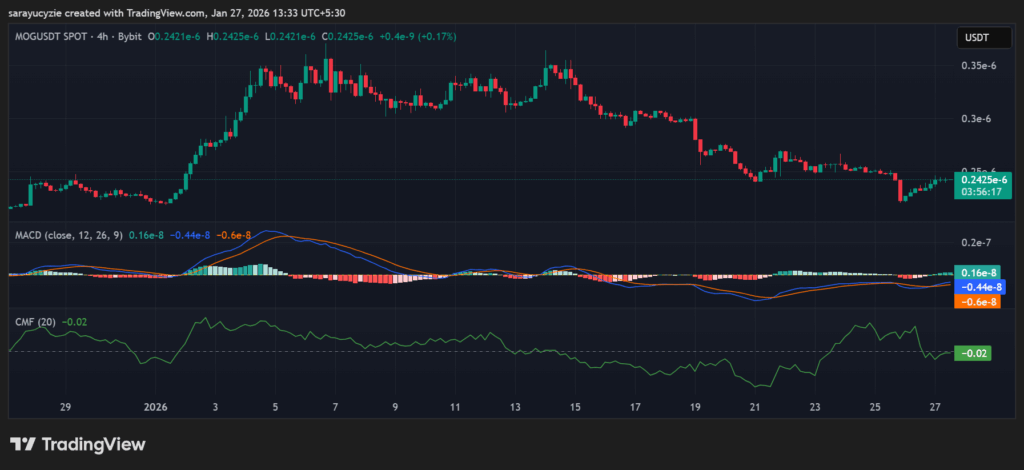 *MOG chart (Source: TradingView)*In addition, the Chaikin Money Flow (CMF) indicator at -0.02 points to a slight negative money flow into the MOG market. More capital is moving out, but the pressure is weak, not aggressive. There is a mild selling interest rather than a strong bearish market confidence.
The daily Relative Strength Index (RSI) of Mog Coin at 47.42 suggests neutral sentiment, neither overbought nor oversold. Notably, there is no clear directional bias, and the market is in a consolidation phase. Furthermore, MOG’s Bull Bear Power (BBP) reading is 0.0000000056, very close to zero. This displays a balance between bullish and bearish pressure within the market, hinting at low momentum in the price action.
Top Updated Crypto News
Hyperliquid (HYPE) Ignites a 22% Rally: Can Bulls Chase $30 as Volatility Creeps In?
Disclaimer: The information on this page may come from third parties and does not represent the views or opinions of Gate. The content displayed on this page is for reference only and does not constitute any financial, investment, or legal advice. Gate does not guarantee the accuracy or completeness of the information and shall not be liable for any losses arising from the use of this information. Virtual asset investments carry high risks and are subject to significant price volatility. You may lose all of your invested principal. Please fully understand the relevant risks and make prudent decisions based on your own financial situation and risk tolerance. For details, please refer to
Disclaimer.
Related Articles
Ethereum Approaches Cycle Low as Bitmain Indicates Violent Belief
The article explores Ethereum's potential market bottom, highlighting its correlation with past S&P 500 trends and significant institutional investment by Bitmain. Despite mixed market sentiment, historical patterns suggest possible recovery.
CryptoBreaking1h ago
Analyst: If Bitcoin falls below the $66,000 support level, it may trigger a 10%-20% correction
Gate News reported that on March 20, Chartered Market Technician (CMT) Aksel Kibar stated on March 21 that the lower support boundary of Bitcoin's potential rising wedge formation is located at 66,000, and a breakdown below this level could trigger a bearish reversal. Aksel Kibar pointed out that rising wedges, as a classic technical pattern, typically appear at the end of uptrends, signaling price momentum exhaustion. Historical data shows that after similar downside breakdowns are confirmed, the average pullback ranges from 10%-20%.
GateNews3h ago
Bitcoin Slips Below $70,000 as Fed Rate Pause and Oil Surge Pressure Markets
Bitcoin declined to $70,000 due to steady interest rates from the Federal Reserve and rising energy prices, leading to $600 million in liquidations and increased market volatility, particularly affecting altcoins.
CryptoBreaking3h ago
XRP Climbs 3% Past $1.47 as Breakout Extends on Bitcoin-Led Rally
Key Takeaways
XRP broke above $1.426 resistance after months of consolidation, jumping to $1.47 on surging volume
Trading volume spiked over 250% during the move, indicating strong participation in the breakout
Activity on the XRP Ledger continues climbing, with tokenized real-world assets
CryptoBreaking3h ago
BTC down 0.65% in 15 minutes: Large spot selling orders dominate short-term pullback, panic sentiment intensifies volatility amplification
2026-03-20 13:45 to 2026-03-20 14:00 (UTC), BTC declined 0.65% within 15 minutes, with price range fluctuating between 69795.3 to 70399.4 USDT, reaching an amplitude of 0.86%. Market volatility intensified in the short term, trading activity increased, and investor attention rose.
The main driver of this price movement was concentrated large-scale active selling in the spot market. During this period, major trading platforms saw multiple large sell orders exceeding 100 BTC each, with sell orders accounting for 52% of volume, directly driving prices downward.
GateNews5h ago
