Hyperliquid rose 8% on Wednesday, with a weekly increase of 50%, breaking through the 200-day EMA. Pump.fun increased by 17%, approaching the $0.003399 resistance level, with a potential 40% breakout. Zcash gained 21% over two days before encountering resistance at $400. HYPE’s RSI reached 70, indicating overbought conditions; PUMP is at 62, and ZEC is at 48, turning neutral.
Hyperliquid Breaks Through 200-Day Moving Average to Initiate Uptrend
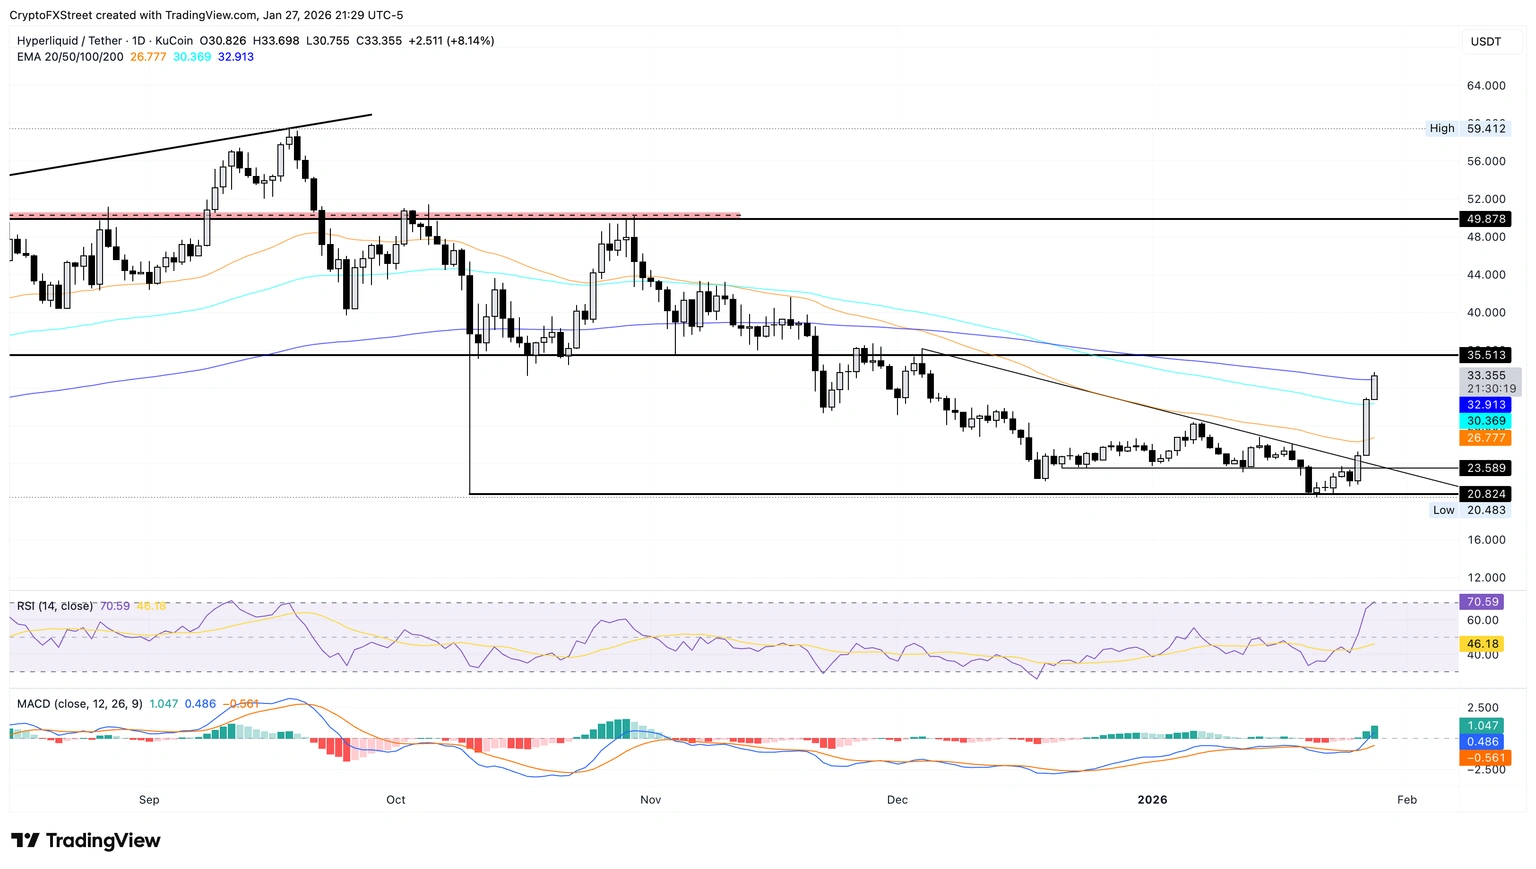
(Source: Trading View)
Hyperliquid’s price hovers around the $32.91 level near the 200-day exponential moving average (EMA), bouncing for three consecutive trading days. As of the time of writing, HYPE rose 8% on Wednesday, continuing Tuesday’s 23% gain, with a weekly increase of about 50%, making it the standout in the altcoin market. This explosive rally occurred amid Bitcoin’s slight rebound on Tuesday, indicating HYPE is attracting independent capital interest outside of the broader market.
The 200-day EMA is one of the most important long-term trend indicators in technical analysis. When the price is above the 200-day EMA, it is generally considered a long-term uptrend; breaking below it signals entering a bear market zone. Hyperliquid’s successful break above and stabilization above this line marks a confirmed trend reversal from a technical perspective, shifting from a bear to a bull structure. Such a breakout often attracts trend followers and institutional investors, creating a self-reinforcing positive cycle.
If the exchange token price remains above $32.91, it may test the key resistance at $35.51, a level that limited its gains in early December. $35.51 is a previous high area; breaking through this level would open the door to the $40 psychological barrier, representing approximately a 20% upside from current levels. This target is plausible given HYPE’s strong upward momentum.
The Moving Average Convergence Divergence (MACD) has broken above the signal line and zero line, showing a parabolic rise, with the histogram expanding above zero, indicating strong bullish momentum. The parabolic MACD rise is a sign of a very strong trend initiation, often with considerable upside potential ahead. Meanwhile, the Relative Strength Index (RSI) has reached 70, entering overbought territory, suggesting buying pressure has reached a critical level.
RSI at 70 is a delicate position. On one hand, it confirms strong upward momentum; on the other, it warns of potential technical corrections in the short term. However, in a strong rally, RSI can remain in overbought zones (70-90) for extended periods, with prices continuing to hit new highs. Therefore, RSI overbought should be viewed as a “caution signal” rather than an “immediate sell signal.” Traders may consider partial profit-taking but do not need to liquidate all positions.
Conversely, if HYPE reverses from the 200-day moving average, it could test the 100-day moving average at $30.62. This is the last defensive line for the bulls; a breakdown would undermine the current bullish structure, possibly causing the price to fall back toward the previous support zone around $28.
Pump.fun Targets 40% Upside Potential
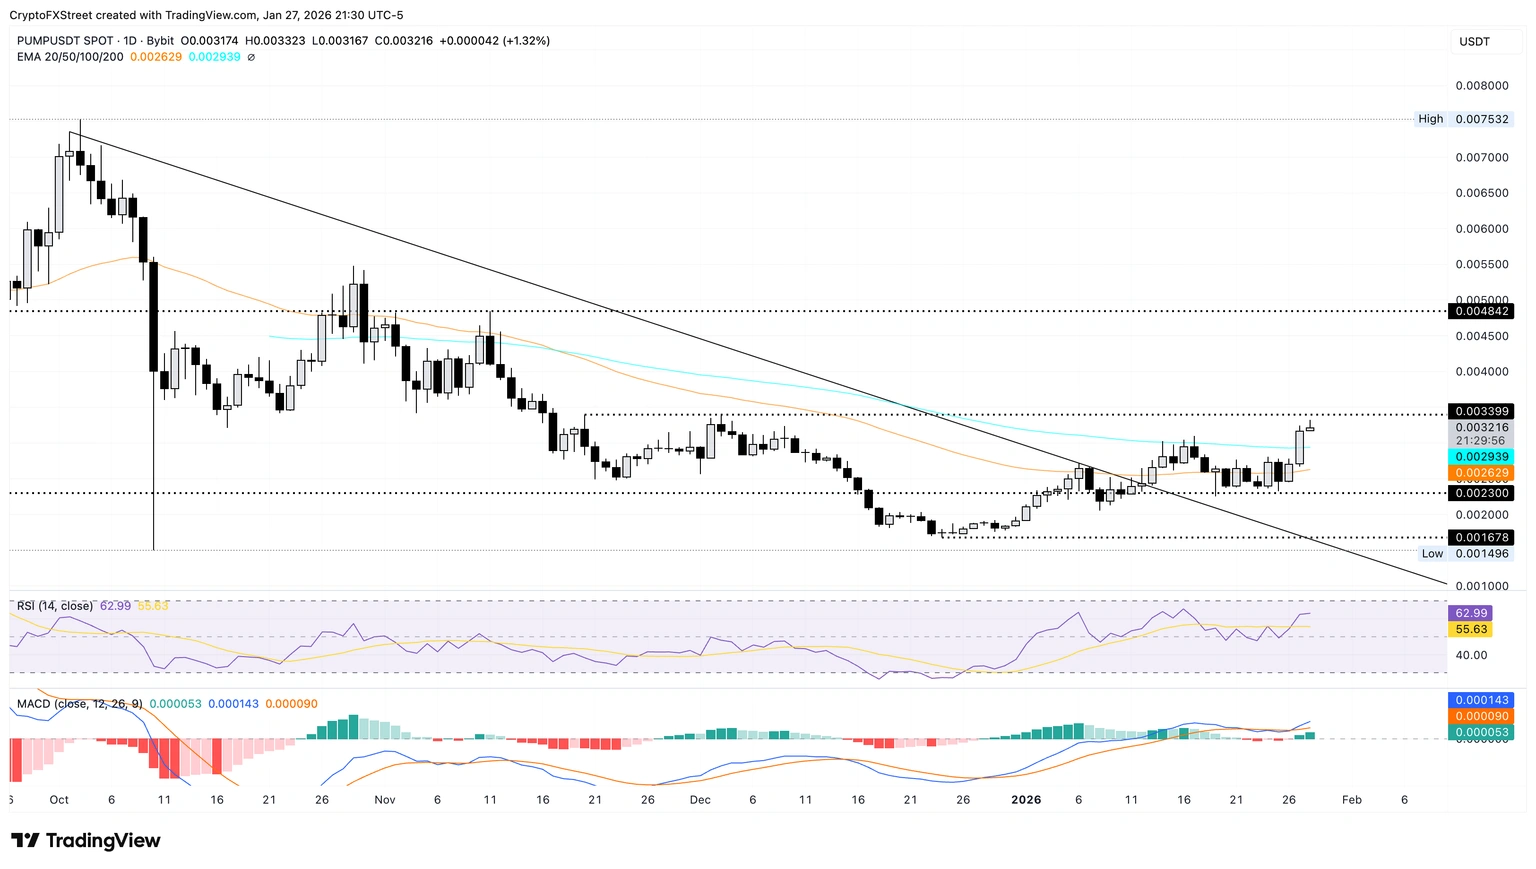
(Source: Trading View)
As of Wednesday’s close, Pump.fun’s trading price was above $0.003000, having risen 17% the previous day. This Solana-based meme coin issuance platform is approaching the key resistance at $0.003399, which is the high point from November 20 and a critical level that has been tested multiple times without success.
If PUMP breaks this level, it could open the door to $0.004842, the last test was on November 11, indicating over 40% upside from current levels. This potential gain is highly attractive in the altcoin market, especially for risk-tolerant investors. However, a 40% upside also entails similar downside risk, so traders should set strict stop-losses.
After the MACD golden cross on Monday, both the MACD and signal line have risen, with the histogram expanding above zero, indicating increasing bullish momentum. This sustained MACD expansion is a healthy sign of an early-stage trend. Meanwhile, RSI is around 62, showing steady increasing buying pressure, with room to grow before entering overbought territory.
RSI at 62 is an ideal position, confirming the upward trend without reaching extreme overbought levels, providing ample technical space for further gains. Historical experience shows that when RSI moves from 60 to break through 70, it often accompanies accelerated price increases. Therefore, PUMP’s current technical setup is highly favorable for bulls.
Pump.fun Two Possible Scenarios
Bullish Scenario: Break above $0.003399 resistance, target $0.004842 (+40%), with stop-loss at $0.002939 below the 100-day moving average.
Bearish Scenario: Fail to break resistance and fall back, testing the $0.003000 round number, with a break below that pointing toward the 100-day moving average at $0.002939.
Zcash Faces Resistance at $400 in a Tug-of-War
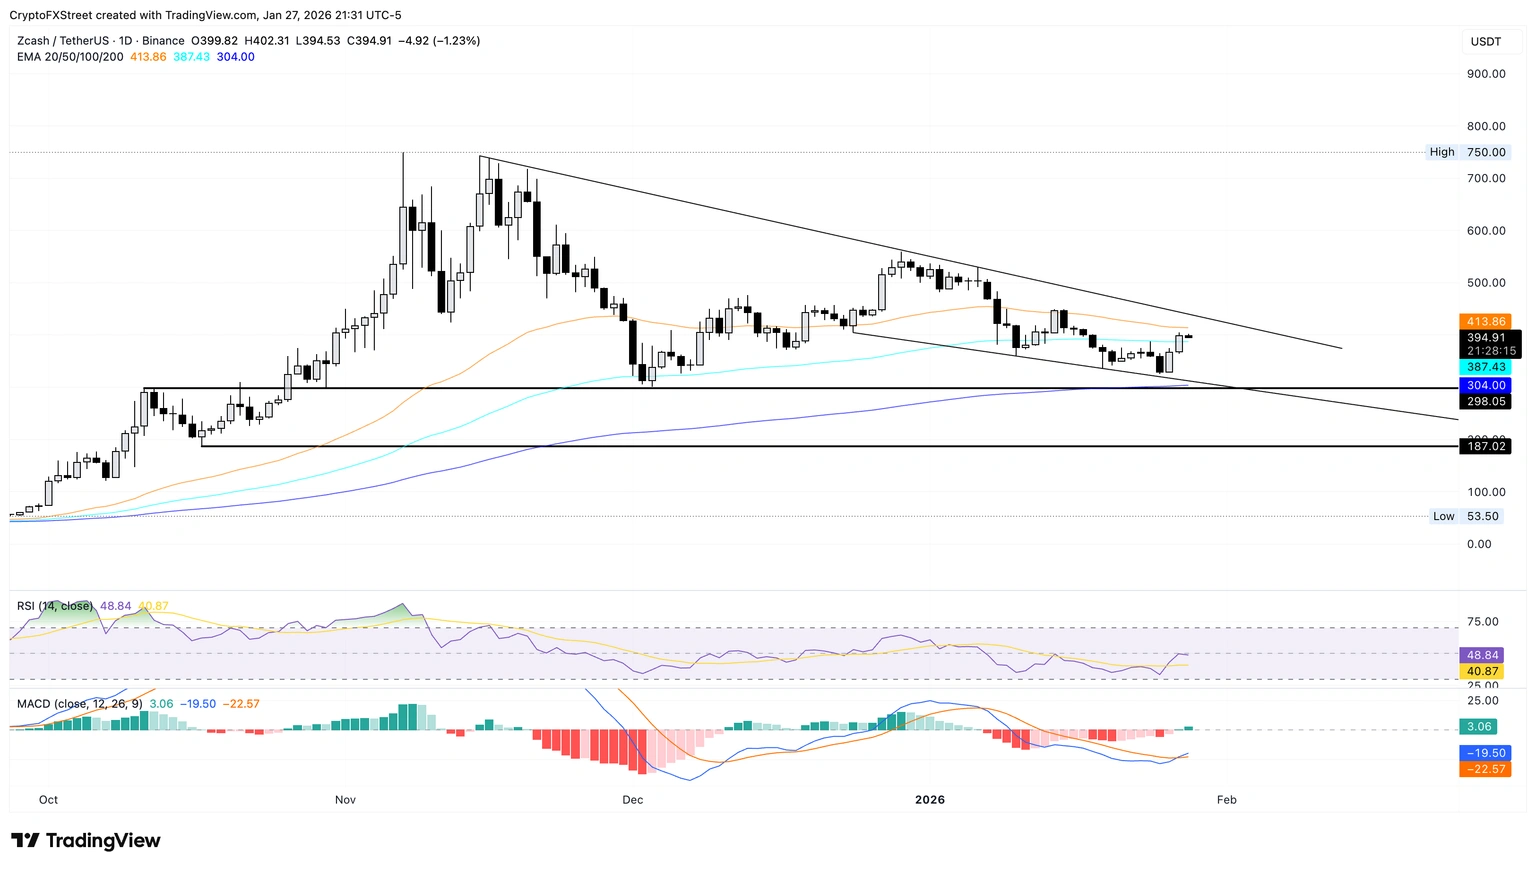
(Source: Trading View)
After rising over 20% in the past two days, Zcash faces resistance near $400, approaching the 50-day moving average at $413. As of the time of writing, ZEC is consolidating above the 100-day moving average at $387, having retraced 1% on Wednesday. This sideways movement near a key resistance level is typical of market hesitation, as traders assess whether there is enough momentum to break through.
If ZEC breaks above $413, the target could reach the resistance trendline near $435, with higher targets around the $500 psychological level. The $500 mark is a significant integer and a key price point from Zcash’s previous bull market; breaking this level would be highly symbolic and could attract more capital.
The MACD has crossed above the signal line but remains below zero, indicating a strengthening bullish recovery but not yet confirmed. Only when both MACD and signal lines break above zero can the trend be confirmed as shifting from bear to bull. The current setup suggests ZEC is at a critical turning point, requiring more buying support to complete the breakout. RSI at 48 indicates the market has shifted from bearish to neutral, just one step away from bullish territory at 50.
Conversely, if ZEC falls below the $387 100-day moving average, it could continue downward toward the descending support trendline connecting the lows of December 24 and January 19, around $312. This would represent about a 20% decline from current levels, erasing the recent gains. Therefore, $387 is a crucial support level that bulls must defend.
Disclaimer: The information on this page may come from third parties and does not represent the views or opinions of Gate. The content displayed on this page is for reference only and does not constitute any financial, investment, or legal advice. Gate does not guarantee the accuracy or completeness of the information and shall not be liable for any losses arising from the use of this information. Virtual asset investments carry high risks and are subject to significant price volatility. You may lose all of your invested principal. Please fully understand the relevant risks and make prudent decisions based on your own financial situation and risk tolerance. For details, please refer to
Disclaimer.
Related Articles
Is this the perfect buying point for Bitcoin? PlanB updates the S2F model: the average price in this cycle is expected to reach $500,000
Quantitative analyst PlanB has made a new Bitcoin forecast, estimating that the average price from 2024 to 2028 will reach $500,000, based on its S2F model. The model calculates scarcity through asset stock and annual production, indicating that the market is currently entering a buying opportunity. PlanB emphasizes the historical accuracy of the forecast but also acknowledges the model's blind spots and the need to pay attention to market demand changes.
区块客3m ago
Mining one Bitcoin results in a loss of 20,000! Miners collectively shift to AI, rewriting the Bitcoin mining model
Bitcoin mining faces losses in 2026, prompting mining companies to pivot to AI to address market challenges. Many enterprises are liquidating Bitcoin assets and reallocating resources to AI data centers, as the profit potential of AI is highly regarded. Data shows that this shift could have a positive impact on Bitcoin's long-term supply structure, and market sentiment also indicates potential rebound signals. Although this transformation may temporarily affect hash rate growth, in the long run, it will enhance the resilience and security of the Bitcoin network.
MarketWhisper14m ago
Solana Price Prediction: 30 Institutions Bet $540 Million on Solana ETF, Can SOL Hold $80 and Break $100?
Although Solana (SOL) has recently maintained stable prices, approximately 30 institutional investors collectively hold around $540 million in Solana ETF positions, indicating interest in long-term investment. Currently, SOL is fluctuating around $80 to $90, with $80 being a key support level. A break below could signal a drop below $64. Analysts believe that institutional capital inflows will influence SOL's future performance.
GateNews16m ago
Bitcoin Price Prediction: Wall Street Funds Flow Back into BTC, ETF Attracts $167 Million in a Single Day, Altcoin Funds Continue to Withdraw
Institutional funds are flowing back into the Bitcoin market, with the US stock spot Bitcoin ETF recording a net inflow of $167 million, while investments in Ethereum and others are continuously withdrawing. The current price of Bitcoin is approximately $71,000. Analysts believe that under the influence of the macro environment and geopolitical factors, institutions prefer Bitcoin. Long-term institutional holdings are still increasing, with future target prices possibly ranging from $110,000 to $170,000. On the technical side, $72,000 is an important resistance level, and a drop below $65,000 could trigger a correction.
GateNews17m ago
Crypto Prices Remain Flat While Asia Secures Natural Gas Supplies
Crypto prices remained flat, with BTC and ETH showing minor declines. Asia secured new natural gas supplies amid conflict fears. In US stock indexes, Nasdaq rose slightly while Dow and S&P 500 fell, reflecting mixed market reactions.
TheNewsCrypto20m ago
Bitcoin drops below $70,000: Iran conflict and US CPI ahead trigger risk aversion, market closely watches the $80,000 key level
Bitcoin price drops below $70,000 again due to geopolitical risks and market caution. Trump's warning to Iran has increased market uncertainty, and high oil prices are affecting investor confidence, despite institutional continued buying of Bitcoin. Market sentiment remains cautious, with investors paying attention to U.S. CPI data and the progress of the CLARITY Act.
GateNews28m ago