- A 5% gain of Zcash has pushed the price to $390.
- Daily trading volume for ZEC is up by over 20%.
After a brief recovery attempt, the crypto market opened the day with mixed sentiment, showing both red and green charts across tokens. The broader market sentiment is still fearful, as the Fear and Greed Index value is at 37. Bitcoin (BTC), the largest asset, is hovering at $89K, attempting to escape the bear trap
Meanwhile, one of the top trending coins is Zcash (ZEC), which has posted a 5.26% gain over the last 24 hours. In the early hours, the asset traded at a bottom of $370.66, and with a mighty bullish shift, the ZEC price has tested and broken many crucial resistance ranges and likely climbed to a high of $403.46
At the time of writing, Zcash trades within the $390.84 zone, with its daily trading volume having increased by over 20.8%, reaching the $573.97 million mark. In addition, the market has experienced an event of 24-hour liquidation of $4.00 million worth of ZEC, as reported by the Coinglass data
Zooming in on the recent trading charts, the ZEC/USDT pair has the bullish control in the market. The price could move up to its nearest resistance at around $400.26. An extended upside pressure triggers the bulls to gain more traction, along with the formation of the golden cross, sending the price up above $411.38
Conversely, assuming the Zcash bears initiate a move on the downside, the price might retrace and test the immediate support at the $380.53 level. Further potential bearish correction could strengthen the bears and push the death cross out to unfold, and eventually drive the asset’s price even lower below $369.11.
Zcash Eyes Higher Ground: Technicals Flash Optimism
Zcash’s technical analysis exhibits that the MACD line is found above the signal line, which is a bullish sign. This crossover hints that the potential upward momentum is building. Moreover, the CMF indicator at 0.11 is bullish, with a positive money flow into the asset. ZEC’s buying pressure is stronger than its selling, supporting price strength or an upside continuation
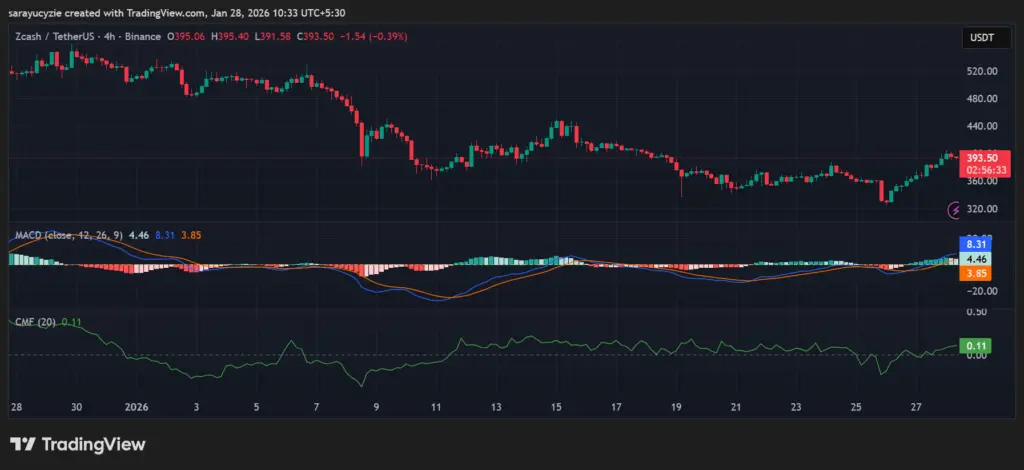 *ZEC chart (Source: TradingView)*The daily RSI of 62.13 suggests moderate bullish sentiment, and it might approach the overbought zone. Significantly, this leaves enough room for further upside for ZEC. Furthermore, the BBP reading of Zcash at 25.78 is strongly bullish, with the bulls dominating price action over the bears. Notably, it points to a short-term overheating if it spikes too fast
Top Updated Crypto News
Eric Trump Shares BTC Holdings of American Bitcoin Corp Months After Nasdaq Debut
Disclaimer: The information on this page may come from third parties and does not represent the views or opinions of Gate. The content displayed on this page is for reference only and does not constitute any financial, investment, or legal advice. Gate does not guarantee the accuracy or completeness of the information and shall not be liable for any losses arising from the use of this information. Virtual asset investments carry high risks and are subject to significant price volatility. You may lose all of your invested principal. Please fully understand the relevant risks and make prudent decisions based on your own financial situation and risk tolerance. For details, please refer to
Disclaimer.
Related Articles
Ethereum Approaches Cycle Low as Bitmain Indicates Violent Belief
The article explores Ethereum's potential market bottom, highlighting its correlation with past S&P 500 trends and significant institutional investment by Bitmain. Despite mixed market sentiment, historical patterns suggest possible recovery.
CryptoBreaking1h ago
Analyst: If Bitcoin falls below the $66,000 support level, it may trigger a 10%-20% correction
Gate News reported that on March 20, Chartered Market Technician (CMT) Aksel Kibar stated on March 21 that the lower support boundary of Bitcoin's potential rising wedge formation is located at 66,000, and a breakdown below this level could trigger a bearish reversal. Aksel Kibar pointed out that rising wedges, as a classic technical pattern, typically appear at the end of uptrends, signaling price momentum exhaustion. Historical data shows that after similar downside breakdowns are confirmed, the average pullback ranges from 10%-20%.
GateNews3h ago
Bitcoin Slips Below $70,000 as Fed Rate Pause and Oil Surge Pressure Markets
Bitcoin declined to $70,000 due to steady interest rates from the Federal Reserve and rising energy prices, leading to $600 million in liquidations and increased market volatility, particularly affecting altcoins.
CryptoBreaking3h ago
XRP Climbs 3% Past $1.47 as Breakout Extends on Bitcoin-Led Rally
Key Takeaways
XRP broke above $1.426 resistance after months of consolidation, jumping to $1.47 on surging volume
Trading volume spiked over 250% during the move, indicating strong participation in the breakout
Activity on the XRP Ledger continues climbing, with tokenized real-world assets
CryptoBreaking4h ago
