
Key Takeaways
-
SKY is forming a rounding bottom pattern on the daily chart
-
Price has rebounded strongly from the $0.0419 demand zone
-
Rising volume supports improving bullish momentum
-
A breakout above $0.0778 could confirm trend reversal
-
Pattern projection points toward the $0.11 region
Sky (SKY), the native governance and utility token of the Sky Protocol (formerly MakerDAO), has stepped into the spotlight after posting a strong daily move of over 8%, accompanied by a sharp 35% surge in trading volume. While the short-term momentum is drawing attention, the more compelling story is unfolding on the higher timeframe chart.
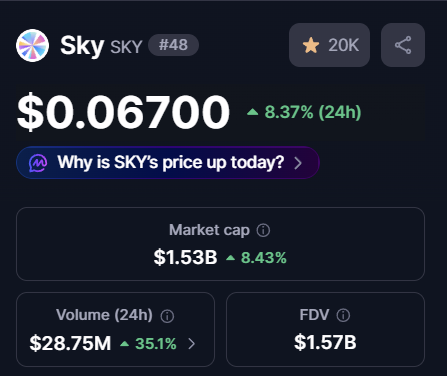
Source: Coinmarketcap
Price action is now forming a classic bullish reversal structure — one that often signals the transition from prolonged weakness into a new recovery phase.
Rounding Bottom Pattern Signals Trend Shift
On the daily timeframe, SKY appears to be completing a rounding bottom formation, a well-known bullish reversal pattern that typically develops after extended downtrends. This structure reflects a gradual shift in market psychology, where persistent selling pressure slowly fades and long-term accumulation begins to dominate.
Earlier in the trend, SKY faced repeated rejection near the $0.0778 neckline resistance, which triggered a steep sell-off. That decline ultimately bottomed near $0.0419, marking a critical demand zone where buyers aggressively stepped in and prevented further downside.
Since establishing this low, price action has steadily curved higher, forming a smooth rounded base. This gradual recovery — rather than a sharp V-shaped bounce — suggests healthier accumulation rather than short-term speculation.
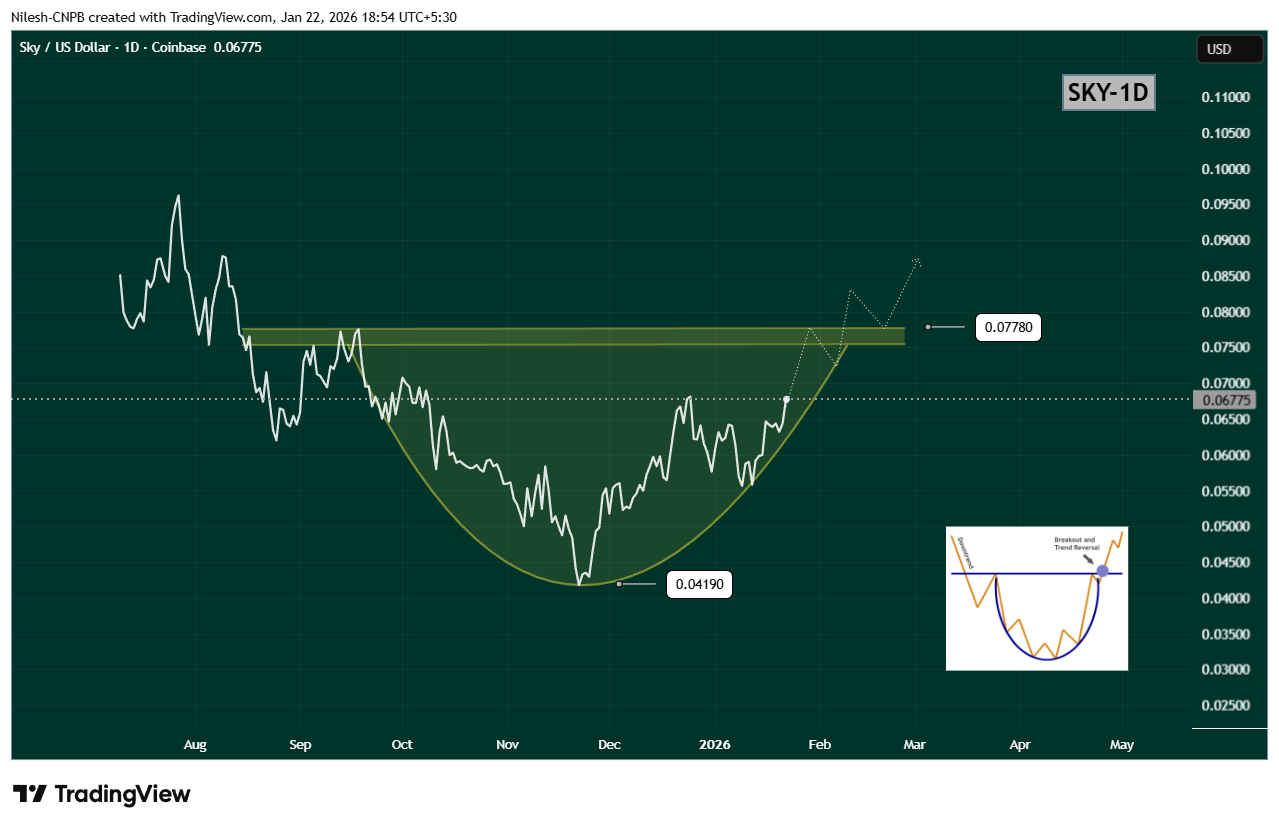
$SKY Daily Chart/Coinsprobe (Source: Tradingview)
Breakout Zone Comes Into Focus
Recent price action shows SKY reclaiming the $0.06933 region, a level that previously acted as resistance. This move strengthens the bullish structure and signals that buyers are gaining confidence ahead of a potential neckline test.
The key level to watch now is the $0.0778 resistance zone. A decisive daily close above this level would confirm the rounding bottom breakout and mark a clear shift in trend structure. Ideally, a breakout followed by a successful retest of this zone as support would further validate the bullish case.
Upside Projection and Risk Outlook
Based on the depth of the rounding bottom, the measured upside projection points toward the $0.11 region. Reaching this target would represent a potential 60–65% upside from current levels, aligning well with historical behavior of similar reversal patterns.
That said, patience remains important. Before any confirmed breakout, SKY could still experience short-term pullbacks or consolidation near the rising curve of the pattern. Such moves would not invalidate the bullish setup, as long as price continues to hold above recent higher lows.
A breakdown below the rounding base would weaken the structure, but for now, momentum favors the bulls.
Bottom Line
SKY is showing clear signs of a trend reversal in progress, with a rounding bottom pattern taking shape on the daily chart. Rising volume, improving structure, and a steady recovery toward neckline resistance all suggest that accumulation is underway.
If SKY can break and hold above $0.0778, the path opens toward the $0.11 region, signaling a broader bullish continuation. Until then, consolidation and minor pullbacks remain possible — but the overall structure is one that traders will be watching closely.
Disclaimer: The views and analysis presented in this article are for informational purposes only and reflect the author’s perspective, not financial advice. Technical patterns and indicators discussed are subject to market volatility and may or may not yield the anticipated results. Investors are advised to exercise caution, conduct independent research, and make decisions aligned with their individual risk tolerance.
About Author: Nilesh Hembade is the Founder and Lead Author of Coinsprobe, with over 5 years of experience in the cryptocurrency and blockchain industry. Since launching Coinsprobe in 2023, he has been providing daily, research-driven insights through in-depth market analysis, on-chain data, and technical research.
Disclaimer: The information on this page may come from third parties and does not represent the views or opinions of Gate. The content displayed on this page is for reference only and does not constitute any financial, investment, or legal advice. Gate does not guarantee the accuracy or completeness of the information and shall not be liable for any losses arising from the use of this information. Virtual asset investments carry high risks and are subject to significant price volatility. You may lose all of your invested principal. Please fully understand the relevant risks and make prudent decisions based on your own financial situation and risk tolerance. For details, please refer to
Disclaimer.
Related Articles
Today, the cryptocurrency Fear & Greed Index rose to 13, indicating extreme fear in the market.
Gate News reports that on March 27, data from Alternative.me shows that today’s cryptocurrency Fear and Greed Index has risen to 13, indicating the market is in a state of "extreme fear." Yesterday, the index was 10, also in the "extreme fear" zone.
GateNews13m ago
23.91% Plunge for KMD: What It Means for Traders
KMD has seen a significant decline, trading at $0.005324 after dropping 54.20% in 24 hours. Increased market activity and liquidation events in the derivatives market are contributing to the volatility, prompting traders to focus on risk management.
Coinfomania21m ago
MemeCore Price Volatility Explodes After Hardfork and Perp Listing Surge - BTC Hunts
The post MemeCore Price Volatility Explodes After Hardfork and Perp Listing Surge appeared first on Coinpedia Fintech News
MemeCore price just pulled off one of those blink-and-you-miss-it moves. A brutal 65% intraday surge sent the token flying from $1.70 to $2.80 only to slam straight into a
BTCHUNTS52m ago
The situation in the US-Iran war worsens, oil prices rise by 4%, and the surge in US Treasury yields impacts US stocks, causing them to fall.
Due to the worsening Middle East situation and soaring U.S. Treasury yields, concerns about inflation have intensified, causing the U.S. stock market to retreat and turning the sentiment cautious. Energy stocks rose against the trend, and crude oil prices broke through $100 per barrel, further fueling market panic. U.S. import prices experienced their largest increase since 2022, and postal services raised fuel surcharges, drawing attention to the consumer confidence index. The Federal Reserve chair succession process has stalled amid political disputes, and the cryptocurrency market remains flat as investors stay on the sidelines.
ChainNewsAbmedia2h ago
Crypto edges off of worst levels after Trump extends Iran strike pause
Bitcoin recovered after President Trump's announcement of a 10-day pause on attacks against Iran's energy infrastructure, helping stabilize markets following recent declines. Despite a volatile day, bitcoin is currently trading above $69,000, while other cryptocurrencies also saw some rebound.
CoinDesk3h ago
BTC 15-minute increase of 0.97%: Driven by active buying and ETF fund inflows pushing the market higher
On March 26, 2026, from 20:00 to 20:15 (UTC), the 15-minute spot Bitcoin (BTC) candlestick return was +0.97%, with a price range of 68,428.7 to 69,460.2 USDT and an amplitude of 1.51%. Trading volume during this period increased by 18% compared to the previous period, reaching approximately $120 million. Market attention significantly intensified, and short-term volatility increased.
The main driver of this movement was strong active buying in the spot market. Specifically, multiple large transfers of ≥1000 BTC appeared on-chain, with net inflows of BTC on major trading platforms totaling approximately 28.
GateNews4h ago
