
RENDER is finally showing signs of a shift on the 4-hour chart. After weeks of grinding lower inside a falling wedge, price has pushed through the upper trendline and now, it moves away from it. That matters, because this kind of structure usually breaks when selling pressure runs out instead of when sellers are in control.
What stands out is how the breakout played out. Volatility had been tightening, price action was compressing, and each sell-off was doing less damage than the last. Once buyers stepped in, the RENDER price broke higher and did not slip back into the wedge immediately…
- Why This RENDER Falling Wedge Break Is Getting Attention
- The RENDER Daily Chart Adds Confirmation
- What Needs to Happen Next
Why This RENDER Falling Wedge Break Is Getting Attention
On the 4-hour chart shared by Clifton a falling wedge is showing up and this normally happens near the end of corrective phases, and that seems to be the case here.
Even though the RENDER price was still printing lower highs, the downside momentum was fading. Sellers were pushing, but they were not getting much in return.
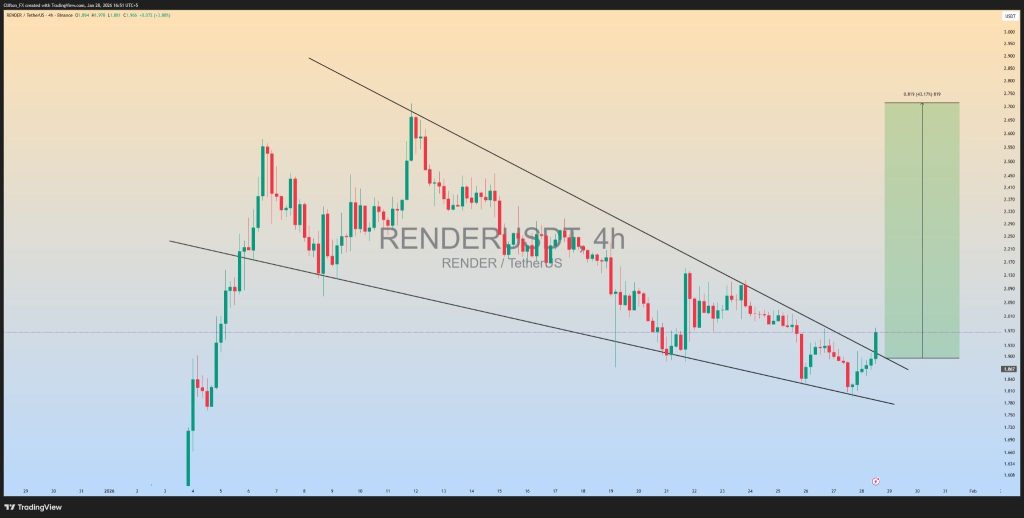
Source: X/@clifton_ideas
Once price cleared the top of the wedge, it opened space for a broader move. The upside projection on the chart highlights how much room the RENDER price could have if momentum continues to build.
It does not mean price shoots straight up, but it does show that this breakout is coming from a compressed base and not an overheated rally. As long as the RENDER price stays above the former wedge resistance, the breakout structure remains valid.
The RENDER Daily Chart Adds Confirmation
The daily chart helps put the move into context. The RENDER price dipped into a key Fibonacci support zone between $1.75 and $1.85, briefly tagging around $1.81 before buyers stepped in.
The price didn’t continue going lower, it quickly bounced back above $1.90, which is exactly what a clean support test usually looks like.
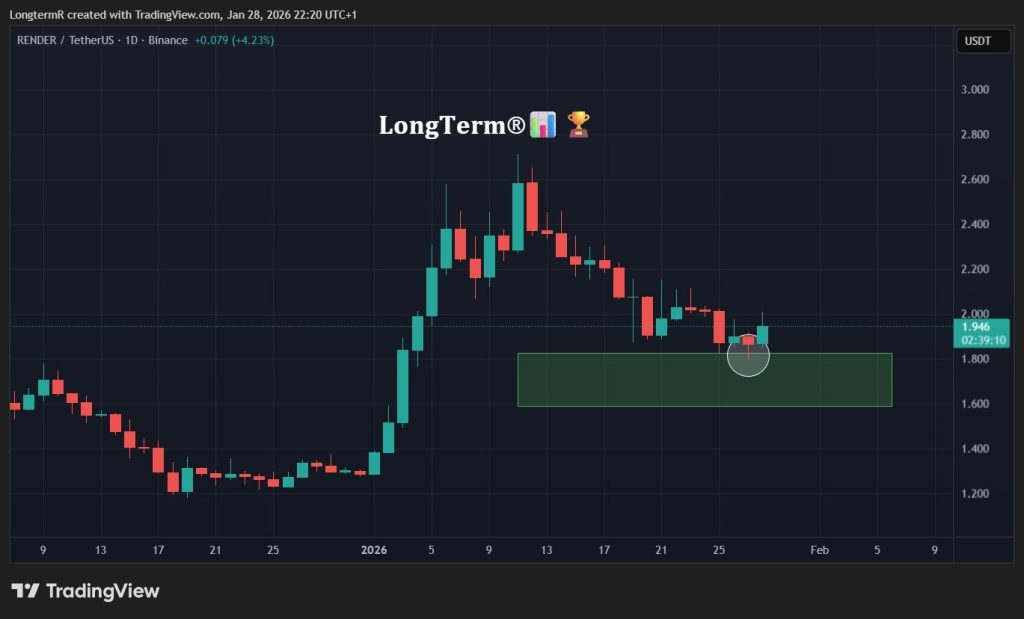
Source: X/@LongTermR
That kind of response suggests there was real demand waiting at those levels. It also supports the idea that this pullback was more of a reset than the beginning of a deeper decline, especially with buyers stepping in so decisively.
With the daily bounce lining up nicely with the 4-hour breakout, the RENDER price continues to hold a constructive structure as long as it stays above the $1.80 zone.
Kaspa (KAS) Price Prediction for February: Recovery Remains Unlikely_**
What Needs to Happen Next
Right now, the RENDER price is sitting at a clear decision point. The 4-hour chart is building steam, and on the daily chart, the support continues to hold at the critical price range of $1.80–$1.85.
In order to sustain the bullish view, the price needs to hold above the recent higher low at $1.81 and not fall back below the former breakout range at $1.85. As long as that happens, the structure remains constructive.
However, if the buyers continue to be on the upper end, RENDER could continue to move towards even stronger resistance levels of $2.10 and $2.30, which were out of reach during the fall.
But if the support levels continue to fall, the chances are that the stock will continue to move sideways between $1.75 and $1.95. The momentum is changing, and the key will be to see if the stock can move above $2.00 and hold on to the level.
Disclaimer: The information on this page may come from third parties and does not represent the views or opinions of Gate. The content displayed on this page is for reference only and does not constitute any financial, investment, or legal advice. Gate does not guarantee the accuracy or completeness of the information and shall not be liable for any losses arising from the use of this information. Virtual asset investments carry high risks and are subject to significant price volatility. You may lose all of your invested principal. Please fully understand the relevant risks and make prudent decisions based on your own financial situation and risk tolerance. For details, please refer to
Disclaimer.
Related Articles
Uptrend Encountering Resistance? Analysis: Bitcoin Rebound May Face Headwinds Between $75,000 and $85,000
Bitcoin is currently around $74,611, facing resistance near the $75,000 level, with $85,000 being a larger resistance zone. Despite bullish signals appearing in the derivatives market and a short-term uptick in risk appetite, the increase in Bitcoin flowing into exchanges may bring profit-taking pressure. Market focus is concentrated on the Federal Reserve's interest rate decision, and if the results fall short of expectations, it will affect the sustainability of Bitcoin's rebound.
区块客10m ago
Chainlink Dominates Discussion in RWA Sector
The RWA (Real World Asset) tokenization sector is drawing significant attention, highlighted by Chainlink's dominance with 14.2 million interactions, far surpassing other projects. The article examines market perceptions and potential for growth among top projects like ONDO and AVAX.
TapChiBitcoin1h ago
Fear and Greed Index Returns Above 40, BTC Weekly Gains 5.66%, ETH Weekly Gains 13%
Data from Xinfire Research Institute shows that from March 11-18, the Nasdaq index declined 1.26%, Bitcoin rose 5.66%, and Ethereum gained 13%. The Fear and Greed Index has exited the extreme fear zone. The Federal Reserve will release statements related to rate cuts tomorrow.
GateNews1h ago
Bitcoin Pulls Back to $73,500, Ethereum Consolidates at $2,300, CryptoQuant: Uptrend Faces Double Resistance, Fed Decision Thursday Becomes Key
Bitcoin reached a high of 75,500 USD today before pulling back to 73,910 USD. CryptoQuant points out that there is double resistance in the 75,000 to 85,000 USD range. The market is awaiting the Federal Reserve's interest rate decision announcement and Powell's assessment of stagflation. If the results are hawkish, it will increase resistance at the 75,000 USD level. Overall market sentiment remains consolidating sideways.
動區BlockTempo2h ago
CryptoQuant Alert: Bitcoin Bounce May Face Resistance Between 75,000 and 85,000 USD
CryptoQuant report shows bullish signals in the Bitcoin futures market, but if the price continues to rise, it will encounter resistance near $75,000 and $85,000. Meanwhile, the inflow of Bitcoin into centralized exchanges is accelerating, which may signal potential selling pressure, creating a contradiction with the bullish sentiment in the futures market.
MarketWhisper3h ago
Why Did Bitcoin Fall Today? Iran's Key Leader Dies, Hormuz Strait Faces Blockade Again
Recent reasons for Bitcoin's decline include geopolitical conflict uncertainty triggered by the death of Iranian wartime official Larijani, the blockade of the Strait of Hormuz pushing oil prices above $100, exacerbating inflation pressures and reducing Federal Reserve rate cut expectations, as well as institutional capital withdrawal. On the technical side, $72,000 is an important support level, and a break below could lead to further exploration toward $64,000.
MarketWhisper3h ago
