
Key Takeaways
-
SKY is forming a rounding bottom pattern on the daily chart
-
Price has rebounded strongly from the $0.0419 demand zone
-
Rising volume supports improving bullish momentum
-
A breakout above $0.0778 could confirm trend reversal
-
Pattern projection points toward the $0.11 region
Sky (SKY), the native governance and utility token of the Sky Protocol (formerly MakerDAO), has stepped into the spotlight after posting a strong daily move of over 8%, accompanied by a sharp 35% surge in trading volume. While the short-term momentum is drawing attention, the more compelling story is unfolding on the higher timeframe chart.
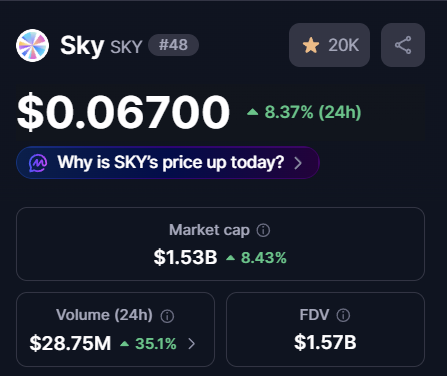
Source: Coinmarketcap
Price action is now forming a classic bullish reversal structure — one that often signals the transition from prolonged weakness into a new recovery phase.
Rounding Bottom Pattern Signals Trend Shift
On the daily timeframe, SKY appears to be completing a rounding bottom formation, a well-known bullish reversal pattern that typically develops after extended downtrends. This structure reflects a gradual shift in market psychology, where persistent selling pressure slowly fades and long-term accumulation begins to dominate.
Earlier in the trend, SKY faced repeated rejection near the $0.0778 neckline resistance, which triggered a steep sell-off. That decline ultimately bottomed near $0.0419, marking a critical demand zone where buyers aggressively stepped in and prevented further downside.
Since establishing this low, price action has steadily curved higher, forming a smooth rounded base. This gradual recovery — rather than a sharp V-shaped bounce — suggests healthier accumulation rather than short-term speculation.
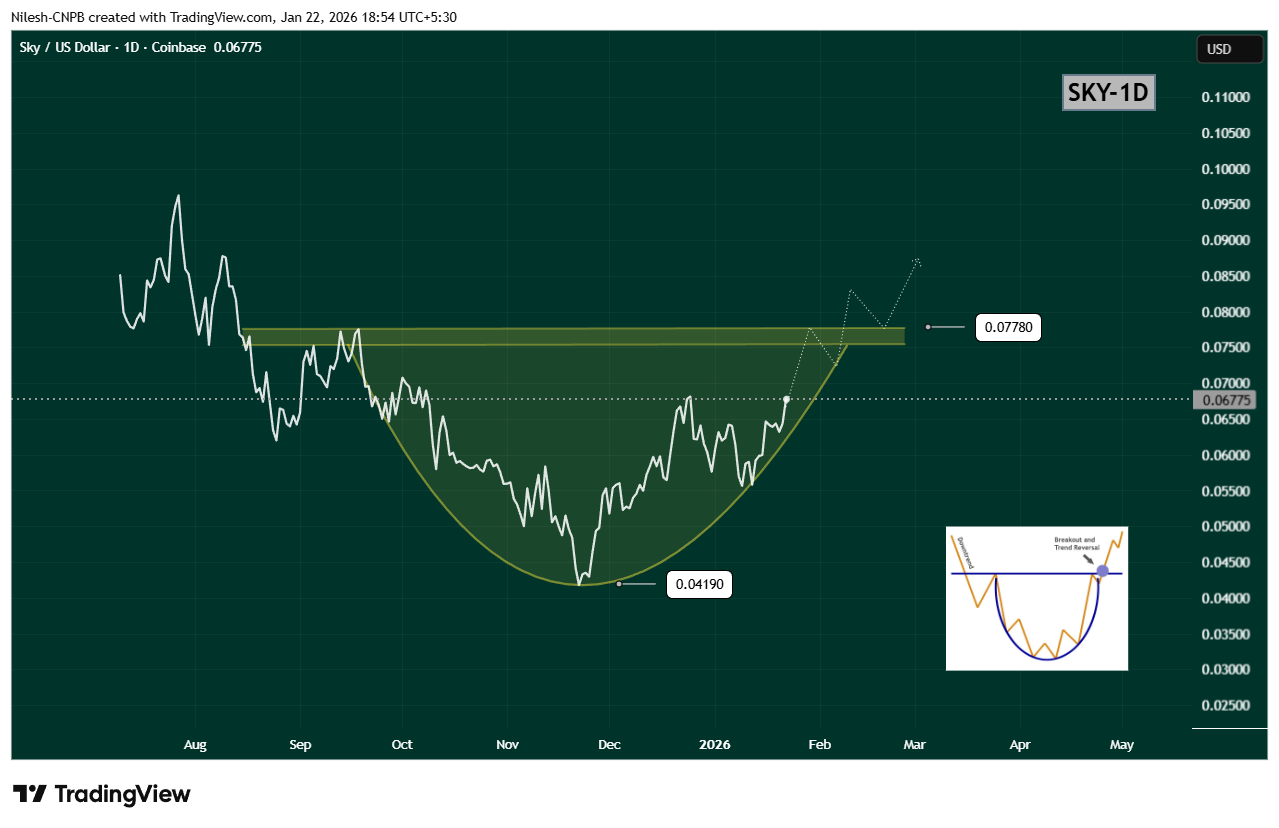
$SKY Daily Chart/Coinsprobe (Source: Tradingview)
Breakout Zone Comes Into Focus
Recent price action shows SKY reclaiming the $0.06933 region, a level that previously acted as resistance. This move strengthens the bullish structure and signals that buyers are gaining confidence ahead of a potential neckline test.
The key level to watch now is the $0.0778 resistance zone. A decisive daily close above this level would confirm the rounding bottom breakout and mark a clear shift in trend structure. Ideally, a breakout followed by a successful retest of this zone as support would further validate the bullish case.
Upside Projection and Risk Outlook
Based on the depth of the rounding bottom, the measured upside projection points toward the $0.11 region. Reaching this target would represent a potential 60–65% upside from current levels, aligning well with historical behavior of similar reversal patterns.
That said, patience remains important. Before any confirmed breakout, SKY could still experience short-term pullbacks or consolidation near the rising curve of the pattern. Such moves would not invalidate the bullish setup, as long as price continues to hold above recent higher lows.
A breakdown below the rounding base would weaken the structure, but for now, momentum favors the bulls.
Bottom Line
SKY is showing clear signs of a trend reversal in progress, with a rounding bottom pattern taking shape on the daily chart. Rising volume, improving structure, and a steady recovery toward neckline resistance all suggest that accumulation is underway.
If SKY can break and hold above $0.0778, the path opens toward the $0.11 region, signaling a broader bullish continuation. Until then, consolidation and minor pullbacks remain possible — but the overall structure is one that traders will be watching closely.
Disclaimer: The views and analysis presented in this article are for informational purposes only and reflect the author’s perspective, not financial advice. Technical patterns and indicators discussed are subject to market volatility and may or may not yield the anticipated results. Investors are advised to exercise caution, conduct independent research, and make decisions aligned with their individual risk tolerance.
About Author: Nilesh Hembade is the Founder and Lead Author of Coinsprobe, with over 5 years of experience in the cryptocurrency and blockchain industry. Since launching Coinsprobe in 2023, he has been providing daily, research-driven insights through in-depth market analysis, on-chain data, and technical research.
Disclaimer: The information on this page may come from third parties and does not represent the views or opinions of Gate. The content displayed on this page is for reference only and does not constitute any financial, investment, or legal advice. Gate does not guarantee the accuracy or completeness of the information and shall not be liable for any losses arising from the use of this information. Virtual asset investments carry high risks and are subject to significant price volatility. You may lose all of your invested principal. Please fully understand the relevant risks and make prudent decisions based on your own financial situation and risk tolerance. For details, please refer to
Disclaimer.
Related Articles
RAIN Crypto Price Dips: Will the $10M Sell-Off Halt Recovery?
RAIN drops over 17% after $10M sell-off despite institutional support.
RAIN trades below key $0.0082 support, raising concerns about market cap decline.
Whale activity and green candles suggest potential rebound if momentum sustains.
Rain Protocol — RAIN, has seen a sharp decline,
CryptoNewsLand4m ago
‘Extreme Fear’ Is Back but Bitcoin’s Price Recovery Depends on it: Santiment
Bitcoin dipped to a four-week low on Friday at $65,500 after it was rejected at $72,000 a few days earlier, which pushed the overall market sentiment back to ‘extreme fear’ territory.
However, the analysts from Santiment believe this could be the precise push BTC needs to stage a notable
CryptoPotato46m ago
XRP Price Analysis: A whale continues to buy, and $1.30 is a key support level
As of the end of March 2026, the price of XRP fluctuates around $1.32, facing key support. The weekly RSI is close to oversold, indicating a potential rebound. If it falls below $1.30, the support levels are at $1.24 and $1.20. Whales continue to accumulate, showing long-term accumulation intent, but on-chain activity is declining, and market liquidity is insufficient.
GateNews51m ago
Ethereum may lose its second place! The rise of stablecoins impacts global market capitalization rankings.
Ethereum is facing market pressure, with a 59% chance of potentially losing its second-place position by 2026. The rapid expansion of stablecoins has significantly brought their market value closer to Ethereum's. Analysis indicates that Ethereum must maintain network usage and price to cope with competition, focusing on whether it can retain its core position.
GateNews54m ago
Solana (SOL) Price News: ETF Outflows and Technical Indicators Show $45-$75 as Key Buying Range
Solana (SOL) price has slightly rebounded after a week of declines, but market sentiment remains cautious. Spot ETF net outflows and derivatives liquidations indicate that institutions are on the sidelines, with SOL's short-term trend leaning bearish, and key support is between $45 and $75. Analysts suggest that below $80 is an accumulation opportunity for long-term holders.
GateNews59m ago
