
Key Takeaways
-
SAND price is showing early signs of stabilization after recent downside pressure.
-
Buyers appear to be defending a key support zone, hinting at a potential short-term rebound.
-
A breakout above nearby resistance could open the door for a stronger recovery move.
Gaming-focused crypto tokens are back in the spotlight after Axie Infinity (AXS) posted a sharp rally of over 16% in a single day and more than 246% over the past month, reigniting optimism around the gaming narrative. Riding this renewed momentum, Sandbox (SAND) has also stepped into focus, climbing nearly 45% as overall market sentiment turns constructive.
Beyond the recent price bounce, the technical structure on the chart is starting to tell a bigger story, hinting that SAND may be setting up for a bullish continuation move.
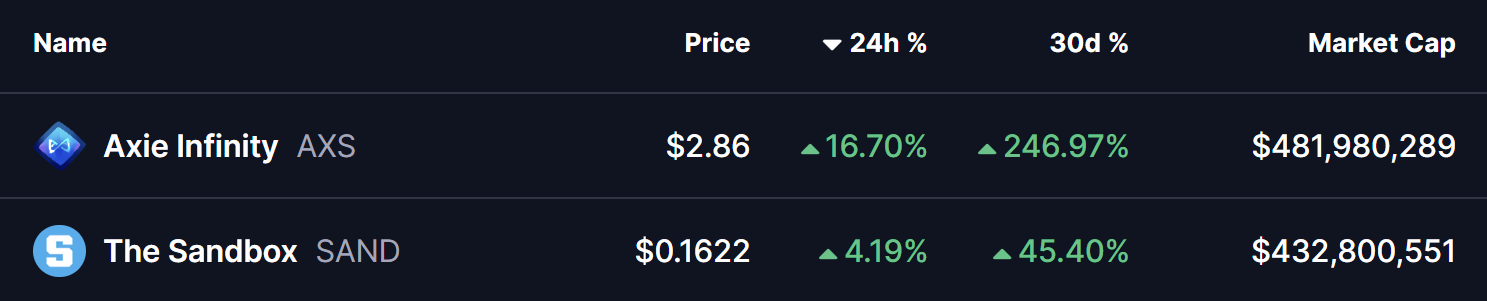
Source: Coinmarketcap
Descending Broadening Wedge Pattern in Play
On the daily timeframe, SAND is trading within a descending broadening wedge — a bullish reversal pattern that often develops during corrective phases before a trend shift. This structure reflects increasing volatility, with price gradually compressing while buyers quietly regain control.
During the latest pullback, SAND successfully retested the lower boundary of the wedge near the $0.11 zone, an area that has repeatedly acted as strong demand. Buyers stepped in aggressively at this level, triggering a rebound that pushed price toward $0.1711, placing SAND right near the wedge’s upper resistance trendline.
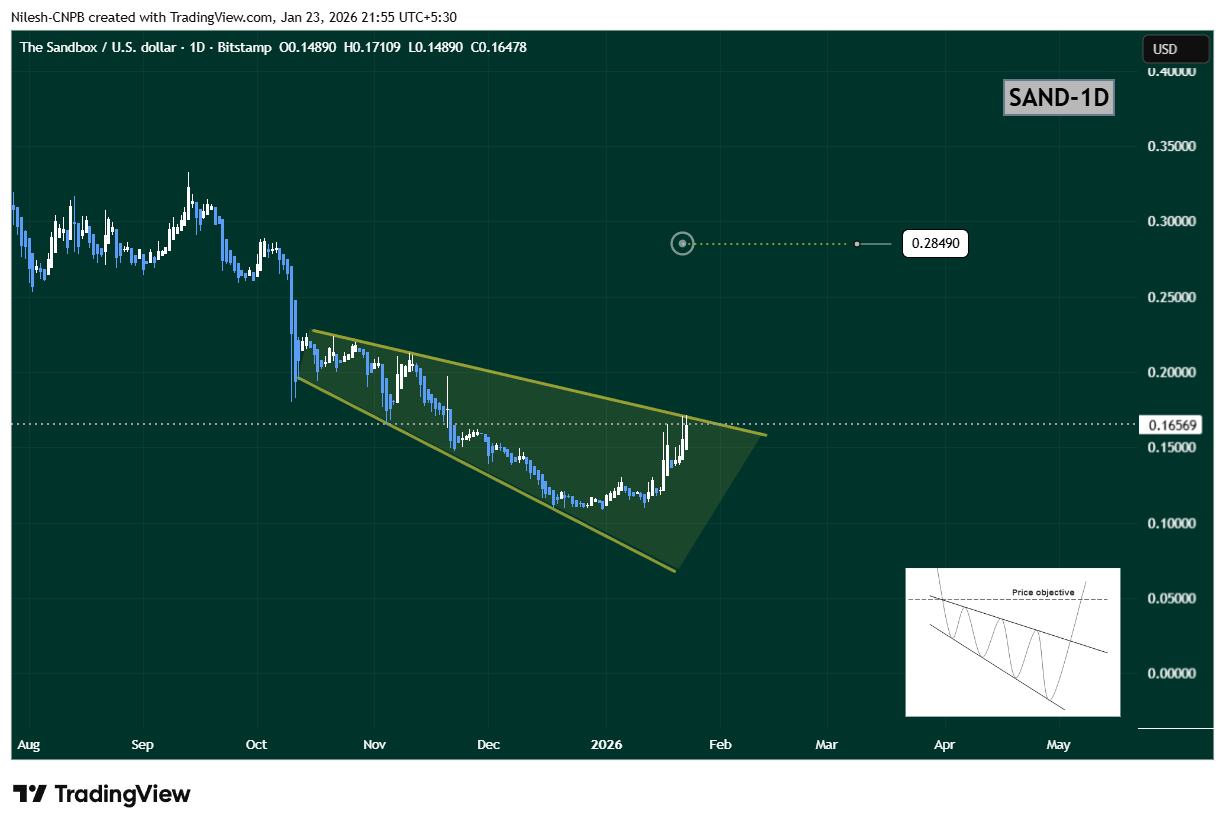
Sandbox (SAND) Daily Chart/Coinsprobe (Source: Tradingview)
The steady rise toward this upper boundary suggests growing bullish momentum and increasing breakout pressure.
What’s Next for SAND?
If buyers manage to push SAND above the upper wedge resistance near $0.1711, it would confirm a bullish breakout from the pattern. In that scenario, the chart opens the door for a move toward the $0.2849 target, which aligns with the measured move of the wedge and represents roughly 73% upside from current levels.
However, if price faces rejection at resistance, SAND could continue consolidating within the wedge structure. In that case, the $0.13–$0.14 region will act as an important short-term support zone to watch.
Bottom Line
SAND’s overall technical structure remains constructive. With a bullish descending broadening wedge in play, buyers defending key support, and gaming tokens gaining renewed attention, Sandbox appears to be positioning for a potential breakout. A confirmed move above resistance could mark the beginning of a stronger upside phase in the sessions ahead.
Disclaimer: The views and analysis presented in this article are for informational purposes only and reflect the author’s perspective, not financial advice. Technical patterns and indicators discussed are subject to market volatility and may or may not yield the anticipated results. Investors are advised to exercise caution, conduct independent research, and make decisions aligned with their individual risk tolerance.
About Author: Nilesh Hembade is the Founder and Lead Author of Coinsprobe, with over 5 years of experience in the cryptocurrency and blockchain industry. Since launching Coinsprobe in 2023, he has been providing daily, research-driven insights through in-depth market analysis, on-chain data, and technical research.
Disclaimer: The information on this page may come from third parties and does not represent the views or opinions of Gate. The content displayed on this page is for reference only and does not constitute any financial, investment, or legal advice. Gate does not guarantee the accuracy or completeness of the information and shall not be liable for any losses arising from the use of this information. Virtual asset investments carry high risks and are subject to significant price volatility. You may lose all of your invested principal. Please fully understand the relevant risks and make prudent decisions based on your own financial situation and risk tolerance. For details, please refer to
Disclaimer.
Related Articles
Pi Network (PI) signals an early recovery after the new mainnet upgrade
Pi Network's recent upgrade to mainnet version 20 enables smart contract deployment, boosting ecosystem development. However, PI token faces downward pressure, trading below resistance levels with bearish technical indicators. Recovery is dependent on surpassing the $0.1950–$0.2000 resistance zone.
TapChiBitcoin3m ago
Bittensor Holds Strength but Faces Resistance Near $285 Level
Key Insights:
Bittensor maintains strong short-term momentum above key averages, while ETF developments and high staking levels continue shaping liquidity and investor demand dynamics.
Overbought technical indicators signal stretched conditions, even as bullish momentum persists,
CryptoFrontNews8m ago
Cardano’s Chart Just Printed a “Black 9” – Here’s Where ADA Price Could Go Next
Ali Martinez highlights a significant technical signal for Cardano, specifically the TD Sequential indicator showing a "black 9," suggesting a potential price reversal after a prolonged downtrend. If ADA maintains support at $0.23, it could rise to $0.32 and $0.37. However, failure to hold this level might invalidate the bullish setup.
CaptainAltcoin18m ago
Market Experts Insist Funds Won't Flow from Gold to Bitcoin, BTC Pullback Synchronizes with XAU
Market expert Benjamin Cowen stated that Bitcoin is unlikely to attract capital inflows due to a gold price pullback. Bitcoin and gold prices show high correlation in volatility, with Bitcoin recently declining from $76,000 to $70,000, while gold plummeted 8.54%. Although Bitcoin's price performance against gold demonstrates resilience, Cowen pointed out that market rotation has not yet occurred, and investors need to monitor Bitcoin's support levels to assess risks.
GateNews22m ago
Six Countries Unite to Stabilize Energy Market, Oil Prices Fall Nearly 2%, Bitcoin Rebounds to $70,800
On March 20, a multi-country coordinated action stabilized the energy market, oil prices fell, and Bitcoin rebounded to $70,800 at one point, gaining over 1% for the day. Mainstream coins such as Ethereum and XRP rose less than 1%. Market uncertainty remains, stock market momentum has shifted to bearish, which could impact financial markets.
GateNews31m ago
Bitcoin Shows Resilience Amid Oil Boom Impact, $70,000 Key Support Level Becomes Rebound Focus
Bitcoin demonstrates resilience amid global market volatility, outperforming most assets despite recent declines exceeding 3%. Analysts point out that the support zone of 69,000 to 70,000 USD is crucial for future price movements, and holding this level could trigger a rebound. Overall, Bitcoin exhibits clear safe-haven characteristics against the backdrop of geopolitical tensions and soaring oil prices.
GateNews33m ago
