
Key Takeaways
-
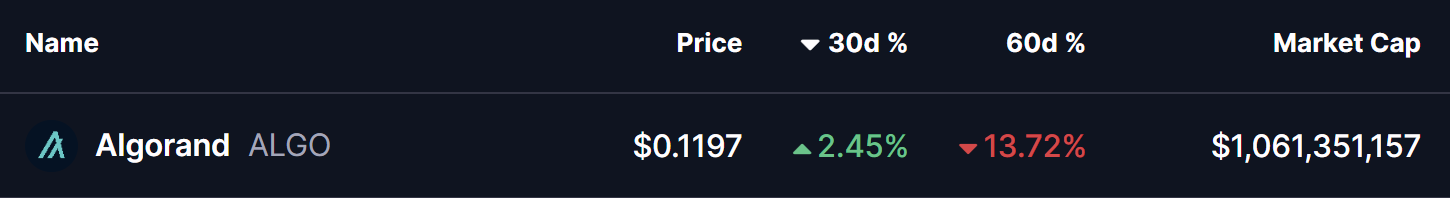
Algorand (ALGO) is consolidating after a 13% decline over the past 60 days, while showing stabilization in the last month.
-
The daily chart reveals a repeating bullish fractal, similar to the setup that triggered ALGO’s 300% rally in November 2024.
-
Price is holding inside a long-term accumulation zone between $0.11 and $0.1530.
-
The 200-day moving average near $0.1912 is acting as key resistance and breakout confirmation level.
-
A successful reclaim of the 200 MA could open the path toward $0.60 and the ascending resistance trendline, while a drop below $0.11 would invalidate the bullish setup.
ALGO, the native token of Algorand’s Layer-1 blockchain, has shown steady but muted momentum over the past 30 days, helping slow down its broader correction. Despite this stabilization, ALGO remains down more than 13% over the last 60 days, keeping sentiment cautious across the market.
That said, when looking beyond short-term price noise, the daily chart is beginning to tell a familiar story. The current structure closely resembles a bullish fractal that, in the past, preceded a powerful breakout rally—raising an important question for traders: is this just consolidation, or a quiet accumulation phase before the next move?
Source: Coinmarketcap
Fractal Setup Hints at a Bullish Reversal
On the daily timeframe, ALGO is displaying early signs of a repeating bullish structure, built around three key technical elements:
-
A rejection from the long-term ascending resistance trendline
-
A prolonged accumulation zone at major historical support
-
A potential reclaim of the 200-day moving average
The current corrective phase began in December 2024, when ALGO was rejected near the ascending resistance trendline around $0.60. That rejection triggered a deep pullback of more than 80%, eventually driving price back into the long-term demand zone between $0.11 and $0.1530—a region that has repeatedly acted as an accumulation area on the chart.
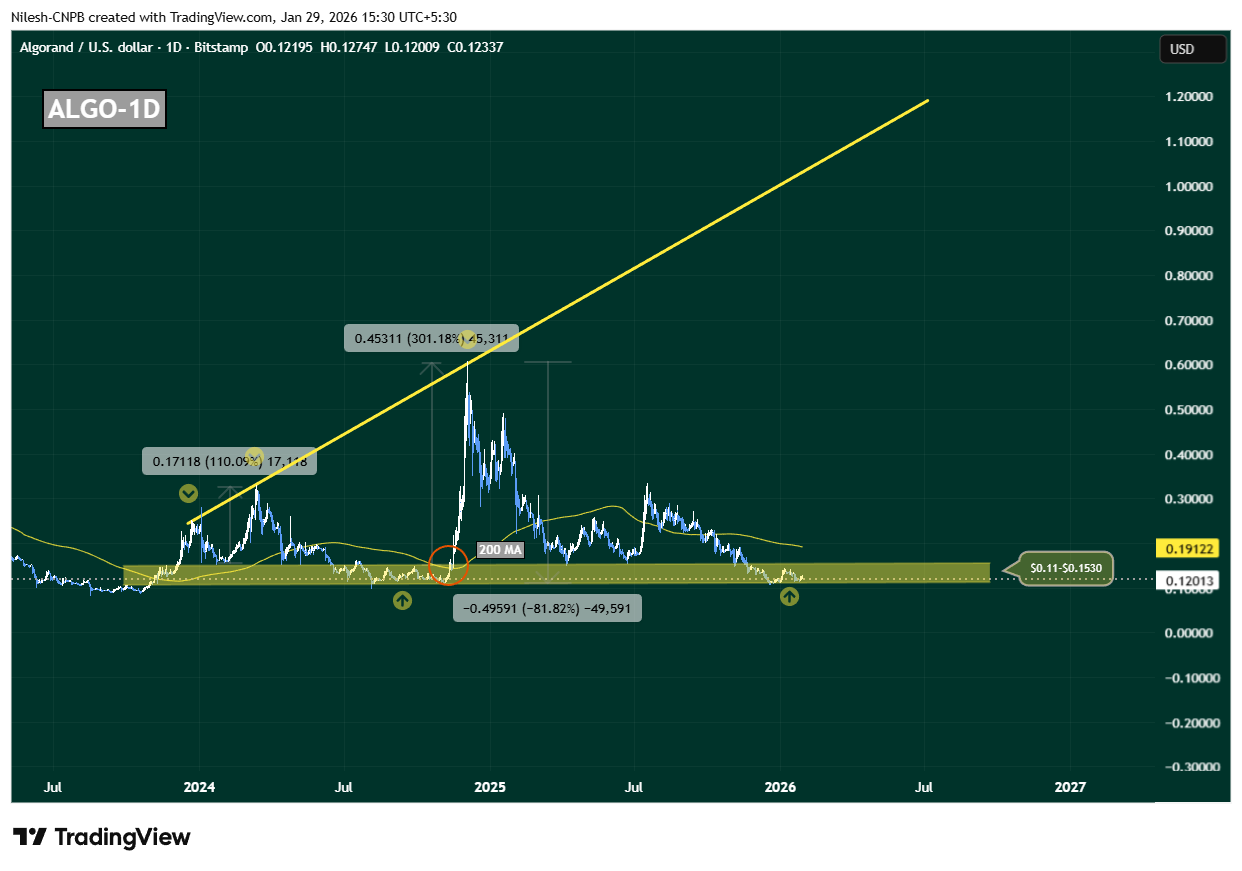
Algorand (ALGO) Daily Chart/Coinsprobe (Source: Tradingview)
This zone is not just technically important; it has also served as a launchpad during previous cycles, where downside momentum stalled and long-term buyers quietly stepped in.
History Rhymes on the ALGO Chart
What makes this setup particularly compelling is how closely it mirrors November 2024’s breakout structure. Back then, ALGO spent extended time consolidating near the same support band before reclaiming the 200-day moving average. Once that level flipped into support, price accelerated sharply—resulting in a 300% rally toward the ascending resistance trendline.
Today, ALGO is once again compressing inside this accumulation range, while the 200-day moving average sits overhead near $0.1912, acting as dynamic resistance. This alignment suggests the market may be approaching another inflection point.
What’s Next for ALGO?
At present, ALGO is hovering near $0.12, firmly inside its long-term accumulation zone. As long as price holds above this region, the broader bullish fractal remains intact.
A clean and sustained reclaim of the 200-day moving average around $0.1912 would be a critical confirmation signal. If bulls manage to flip this level into support, it would closely replicate previous breakout conditions and could trigger a sharp upside expansion. In that scenario, $0.60 becomes a realistic medium-term target, with further upside possible toward the ascending resistance trendline if momentum builds.
However, the structure is not without risk. A decisive breakdown below $0.11 would weaken the accumulation thesis, signal loss of long-term support, and open the door for deeper downside.
For now, ALGO sits at a make-or-break zone. The chart suggests patience is key—but if history repeats, this quiet phase may not last much longer.
Disclaimer: The views and analysis presented in this article are for informational purposes only and reflect the author’s perspective, not financial advice. Technical patterns and indicators discussed are subject to market volatility and may or may not yield the anticipated results. Investors are advised to exercise caution, conduct independent research, and make decisions aligned with their individual risk tolerance.
About Author: Nilesh Hembade is the Founder and Lead Author of Coinsprobe, with over 5 years of experience in the cryptocurrency and blockchain industry. Since launching Coinsprobe in 2023, he has been providing daily, research-driven insights through in-depth market analysis, on-chain data, and technical research.
Disclaimer: The information on this page may come from third parties and does not represent the views or opinions of Gate. The content displayed on this page is for reference only and does not constitute any financial, investment, or legal advice. Gate does not guarantee the accuracy or completeness of the information and shall not be liable for any losses arising from the use of this information. Virtual asset investments carry high risks and are subject to significant price volatility. You may lose all of your invested principal. Please fully understand the relevant risks and make prudent decisions based on your own financial situation and risk tolerance. For details, please refer to
Disclaimer.
Related Articles
TAO Price Explodes 140% in 6 Weeks, But Bittensor’s Social Data Says the Rally Is Just Getting Started
Bittensor has been one of the hardest‑charging assets in crypto in recent weeks. The TAO price pumped 140% in six weeks, and climbed 105% since March 8 alone. The token now has a $2.9 billion market cap, which means it’s ranking 26 overall, as capital rotates toward decentralized machine
CaptainAltcoin23m ago
TAO surges 140%, low retail FOMO turns into a bullish signal
Bittensor (TAO) recently surged by 140%, reaching a high of $377.8, mainly driven by capital rotation in AI-themed investments and supported by solid fundamentals. Although community discussion volume has increased, retail sentiment remains relatively calm, indicating potential upside. The total staked amount on TAO's subnet has risen from $74,400 to over $620 million, reflecting investor confidence in its future.
MarketWhisper24m ago
Is there hidden risk behind Bitcoin holding steady at $70,000? Two major indicators weaken, reducing upward momentum.
Amid increasing geopolitical conflicts and macroeconomic uncertainties, Bitcoin remains steady at $70,000, demonstrating resilience. However, the decline in CEX premiums and slowing ETF capital flows indicate that institutional investors are becoming more cautious, and the market may enter a period of consolidation.
GateNews29m ago
Nick Carter: Bitcoin's quantum resistance lags behind; Ethereum may lead a bullish divergence
Nick Carter warns that Bitcoin is lagging in quantum resistance, emphasizing that its use of elliptic curve cryptography will become outdated and recommending a redesign of replaceable encryption technologies. In contrast, Ethereum has developed a post-quantum upgrade roadmap through 2029 and considers it a top priority. Google also predicts that quantum threats will become a reality before 2029, posing a risk to blockchain security.
MarketWhisper33m ago
Crypto Fear & Greed Index drops to 10, market "fear" sentiment rises
BlockBeats News, March 26 — According to Alternative data, today’s cryptocurrency Fear and Greed Index is 10 (yesterday was 14), indicating increased market "fear" sentiment.
Note: The Fear and Greed Index threshold is 0-100, composed of indicators: volatility (25%), market trading volume (25%), social media activity (15%), market surveys (15%), Bitcoin’s proportion in the overall market (10%), and Google trending searches analysis (10%).
BlockBeatNews35m ago
Pi coin's 7-month low-volatility period has ended; an 108% rebound in volatility signals a major market move.
Pi Network (PI) is currently trading at approximately $0.1883, facing increased volatility and a decreasing correlation with Bitcoin. Recently, volatility has risen from 52% to 108%, indicating the end of the past seven months of compression and the potential for a significant move. However, the correlation coefficient between PI and Bitcoin has dropped to -0.30, suggesting that PI has not benefited from Bitcoin's upward trend. Technical analysis shows that if the price falls below $0.1894, it could drop to $0.1300, while holding above $0.2103 may lead to a rebound toward $0.2442.
MarketWhisper57m ago
