
Key Takeaways
-
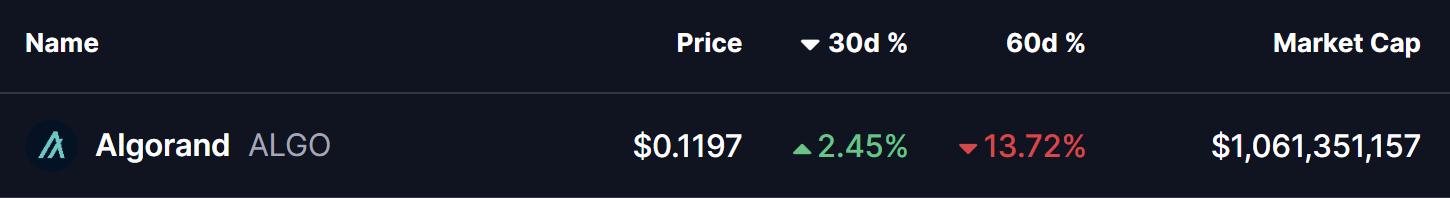
Algorand (ALGO) is consolidating after a 13% decline over the past 60 days, while showing stabilization in the last month.
-
The daily chart reveals a repeating bullish fractal, similar to the setup that triggered ALGO’s 300% rally in November 2024.
-
Price is holding inside a long-term accumulation zone between $0.11 and $0.1530.
-
The 200-day moving average near $0.1912 is acting as key resistance and breakout confirmation level.
-
A successful reclaim of the 200 MA could open the path toward $0.60 and the ascending resistance trendline, while a drop below $0.11 would invalidate the bullish setup.
ALGO, the native token of Algorand’s Layer-1 blockchain, has shown steady but muted momentum over the past 30 days, helping slow down its broader correction. Despite this stabilization, ALGO remains down more than 13% over the last 60 days, keeping sentiment cautious across the market.
That said, when looking beyond short-term price noise, the daily chart is beginning to tell a familiar story. The current structure closely resembles a bullish fractal that, in the past, preceded a powerful breakout rally—raising an important question for traders: is this just consolidation, or a quiet accumulation phase before the next move?
Source: Coinmarketcap
Fractal Setup Hints at a Bullish Reversal
On the daily timeframe, ALGO is displaying early signs of a repeating bullish structure, built around three key technical elements:
-
A rejection from the long-term ascending resistance trendline
-
A prolonged accumulation zone at major historical support
-
A potential reclaim of the 200-day moving average
The current corrective phase began in December 2024, when ALGO was rejected near the ascending resistance trendline around $0.60. That rejection triggered a deep pullback of more than 80%, eventually driving price back into the long-term demand zone between $0.11 and $0.1530—a region that has repeatedly acted as an accumulation area on the chart.
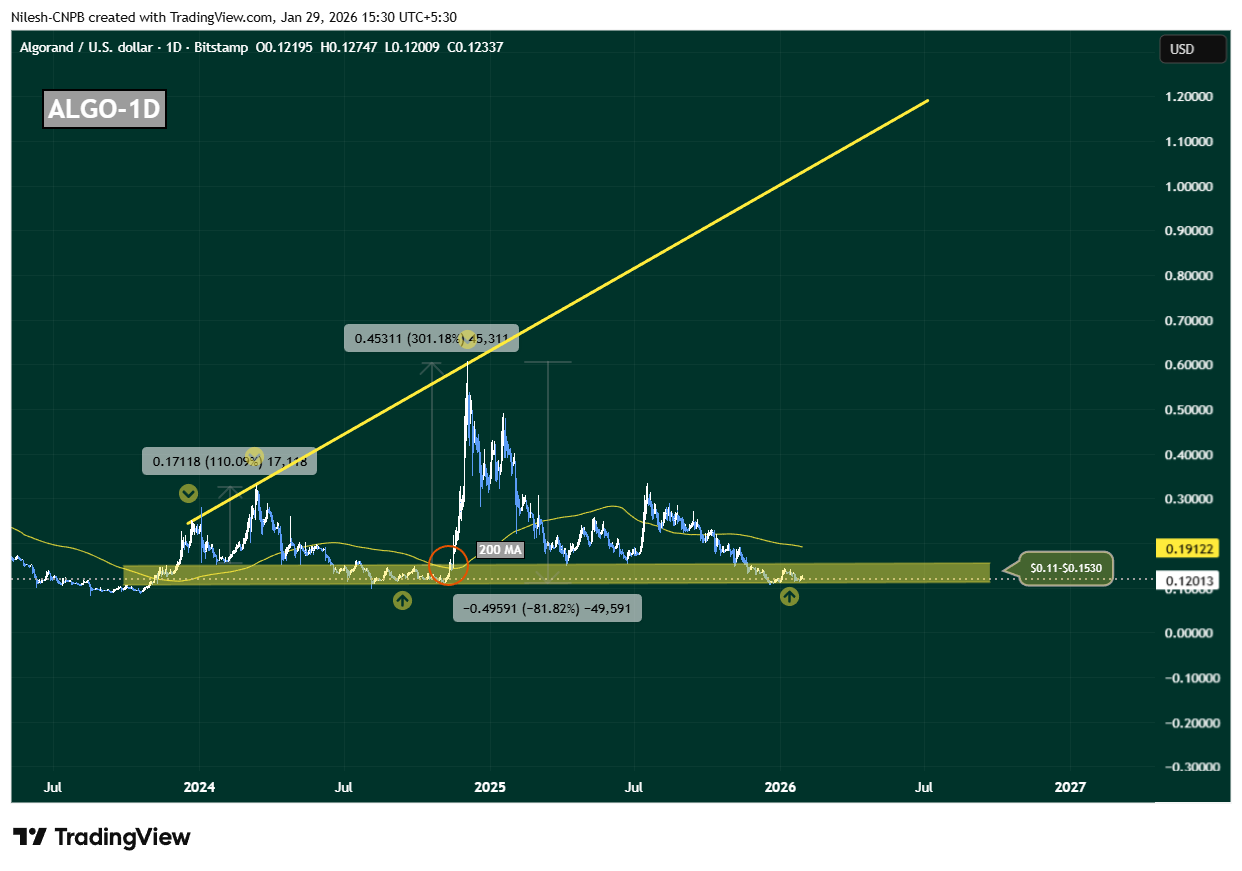
Algorand (ALGO) Daily Chart/Coinsprobe (Source: Tradingview)
This zone is not just technically important; it has also served as a launchpad during previous cycles, where downside momentum stalled and long-term buyers quietly stepped in.
History Rhymes on the ALGO Chart
What makes this setup particularly compelling is how closely it mirrors November 2024’s breakout structure. Back then, ALGO spent extended time consolidating near the same support band before reclaiming the 200-day moving average. Once that level flipped into support, price accelerated sharply—resulting in a 300% rally toward the ascending resistance trendline.
Today, ALGO is once again compressing inside this accumulation range, while the 200-day moving average sits overhead near $0.1912, acting as dynamic resistance. This alignment suggests the market may be approaching another inflection point.
What’s Next for ALGO?
At present, ALGO is hovering near $0.12, firmly inside its long-term accumulation zone. As long as price holds above this region, the broader bullish fractal remains intact.
A clean and sustained reclaim of the 200-day moving average around $0.1912 would be a critical confirmation signal. If bulls manage to flip this level into support, it would closely replicate previous breakout conditions and could trigger a sharp upside expansion. In that scenario, $0.60 becomes a realistic medium-term target, with further upside possible toward the ascending resistance trendline if momentum builds.
However, the structure is not without risk. A decisive breakdown below $0.11 would weaken the accumulation thesis, signal loss of long-term support, and open the door for deeper downside.
For now, ALGO sits at a make-or-break zone. The chart suggests patience is key—but if history repeats, this quiet phase may not last much longer.
Disclaimer: The views and analysis presented in this article are for informational purposes only and reflect the author’s perspective, not financial advice. Technical patterns and indicators discussed are subject to market volatility and may or may not yield the anticipated results. Investors are advised to exercise caution, conduct independent research, and make decisions aligned with their individual risk tolerance.
About Author: Nilesh Hembade is the Founder and Lead Author of Coinsprobe, with over 5 years of experience in the cryptocurrency and blockchain industry. Since launching Coinsprobe in 2023, he has been providing daily, research-driven insights through in-depth market analysis, on-chain data, and technical research.
Disclaimer: The information on this page may come from third parties and does not represent the views or opinions of Gate. The content displayed on this page is for reference only and does not constitute any financial, investment, or legal advice. Gate does not guarantee the accuracy or completeness of the information and shall not be liable for any losses arising from the use of this information. Virtual asset investments carry high risks and are subject to significant price volatility. You may lose all of your invested principal. Please fully understand the relevant risks and make prudent decisions based on your own financial situation and risk tolerance. For details, please refer to
Disclaimer.
Related Articles
The RWA Yield Infrastructure Trade
The essay highlights challenges in direct RWA token exposure, emphasizes the potential in leverage opportunities amid settlement delays, critiques Morpho's governance token structure, and presents Fluid as a more effective token model with stablecoin links.
CoinDesk15m ago
Bitcoin traders keep chasing Trump’s Iran noise. The real signals are elsewhere.
The past four weeks have been brutal for bitcoin BTC$66,462.68 traders as prices keep chasing comments by President Donald Trump, who can't make up his mind about Iran.
One day, he talks peace and BTC and risk assets go up while oil drops, the next day he talks hawkish again, sending BTC down and o
CoinDesk45m ago
Stop fixating on Trump’s remarks? The real Bitcoin price movement signals are in the tanker rates and insurance premiums
Bitcoin is trading sideways near $66,000, influenced by remarks by Trump on the situation in Iran. The shipping and insurance costs in the Strait of Hormuz reflect elevated risk. It is expected that an expanding supply shortfall will continue to weigh on Bitcoin and other risk assets, and in the short term the market may still remain choppy.
GateNews57m ago
Bitcoin, ether, solana slide further as Trump threatens to hit Iran 'extremely hard'
Bitcoin and major cryptocurrencies fell sharply after Trump's address threatened escalated military action against Iran, reversing a previous rally. The ongoing conflict continues to create volatility in the market. Despite historical April gains, optimism is tempered by geopolitical tensions.
CoinDesk2h ago
Trump makes a tough statement to pressure Iran, Bitcoin falls below a key level, and the crypto market is under pressure again
Driven by the impact of Trump’s hardline remarks toward Iran, the crypto market weakened, with Bitcoin and Ethereum falling to $66,609 and $2,056, respectively. Market panic sentiment intensified, and the Fear & Greed Index dropped to 8. War risk pushed energy prices up, suppressing the valuations of risk assets, and in the short term volatility in crypto assets could increase.
GateNews2h ago
Trump’s “Stone Age” speech threatens to seriously hit the market; Bitcoin’s price gives back its gains
U.S. President Trump threatened in a speech to launch even harsher strikes against Iran. The market reacted sharply: Bitcoin and the stock market fell significantly, and oil prices surged. Iran has no intention of backing down and is pushing for legislation on permanent tolls, showing that tensions between the two countries have not eased. The market believes a ceasefire cannot be achieved quickly.
MarketWhisper2h ago
