
Key Takeaways
-
Bitcoin has dropped into the $69K–$74.5K support zone for the first time in ~15 months.
-
BTC is down 23% over 30 days, cooling off from the $126K high.
-
BTC/GOLD continues to respect a long-term ascending triangle.
-
The 200-week MA (~21.81 on BTC/GOLD) remains the key momentum trigger.
-
Holding $69K keeps rebound chances alive; losing it risks deeper consolidation.
Bitcoin has entered a critical phase, sliding into a price zone that hasn’t been meaningfully tested in nearly 15 months. After weeks of steady selling pressure, BTC has dropped back into the $69,000–$74,500 support range—an area that previously acted as a strong base during March 2025.
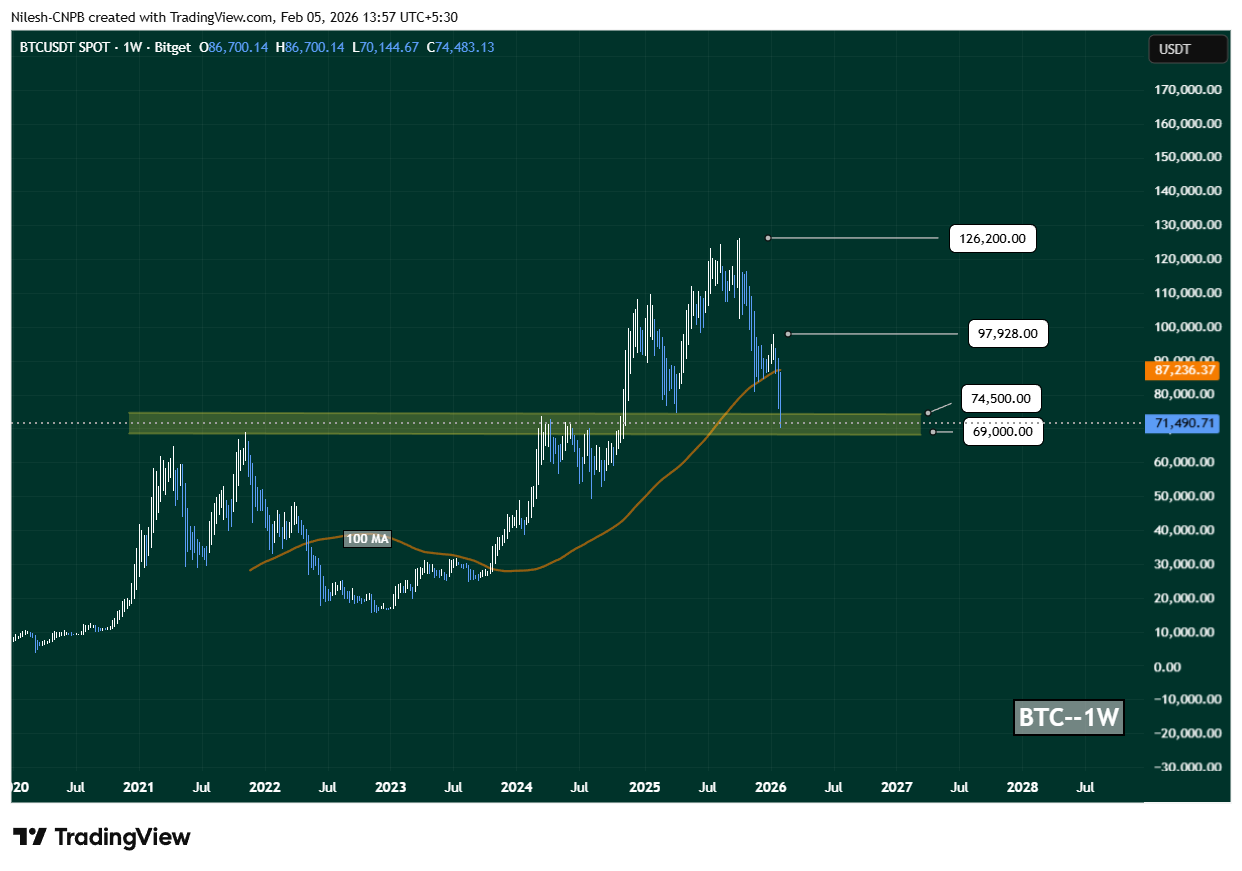
BTC Weekly Chart/Coinsprobe (Source: Tradingview)
As of February 5, 2026, Bitcoin is trading near $71,387, down 6.47% in the last 24 hours. On a broader scale, BTC is now off more than 23% over the past 30 days, giving back a large portion of its explosive rally toward the $126K all-time high and pushing market sentiment firmly back into caution mode.
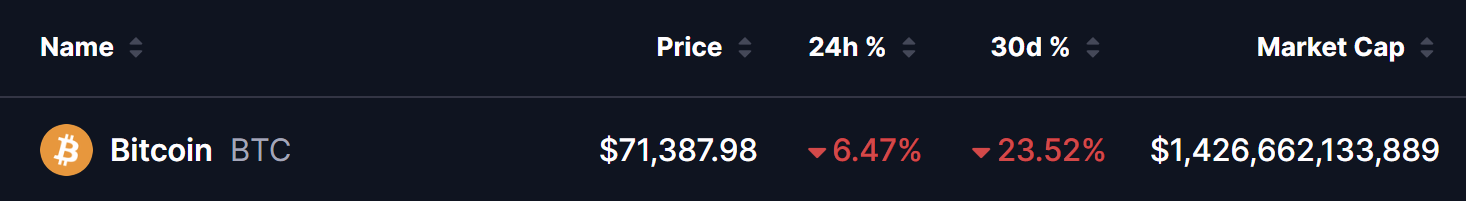
Source: Coinmarketcap
Still, from a technical perspective, Bitcoin is now sitting at a zone where rebounds have historically started.
Zooming out to the BTC/GOLD weekly chart, price action continues to respect a large ascending triangle structure—a pattern often associated with long-term trend reversals or bullish continuation.
This setup is defined by:
-
A rising trendline connecting higher lows all the way back to 2017
-
A horizontal resistance zone between 36.84 and 41.07, which has capped upside multiple times
During the recent gold-driven rotation, BTC/GOLD once again pulled back to test its long-term ascending support near 14.27—a level that has repeatedly acted as a major demand zone across multiple cycles.
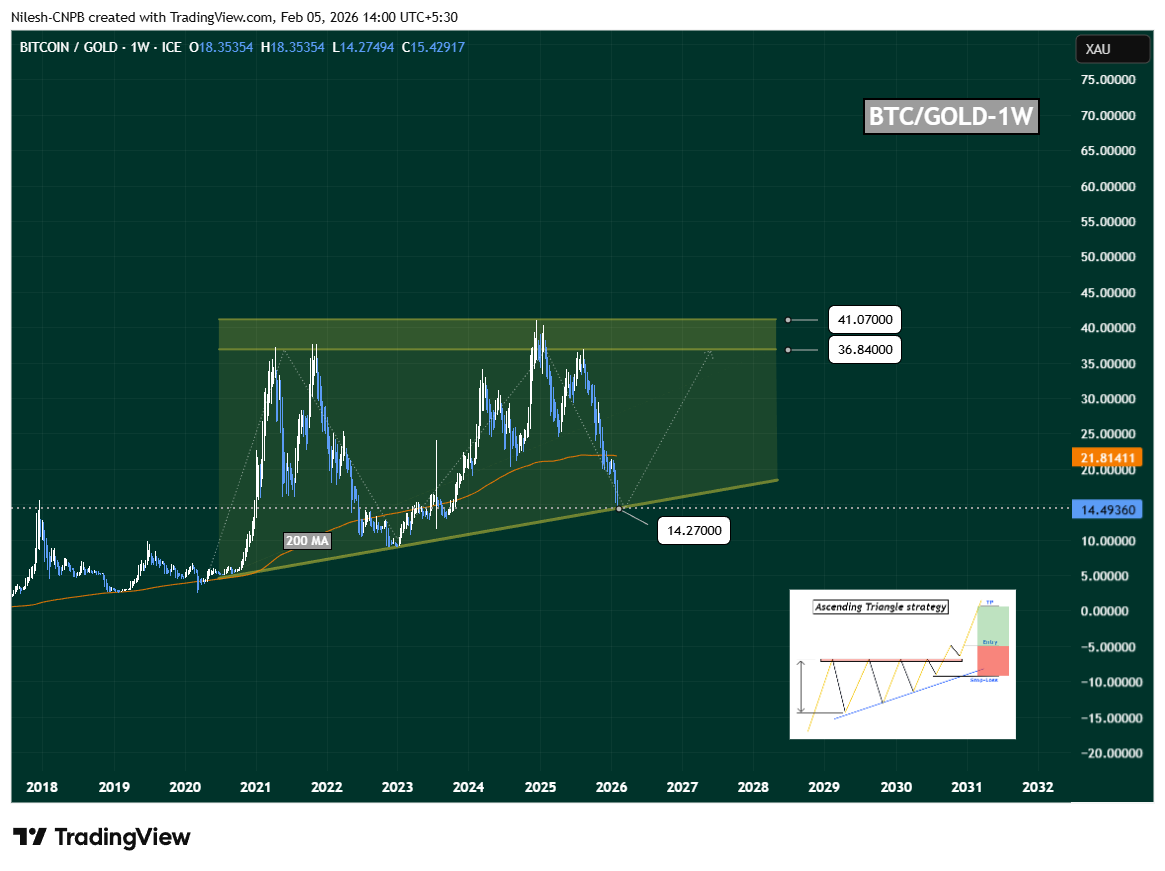
BTC/XAU Weekly Chart/Coinsprobe (Source: Tradingview)
Rather than breaking down, price respected this trendline.
That’s an important detail.
It suggests the current move looks more like a rotation inside the triangle, not a structural failure of the long-term bullish setup.
200-Week Moving Average Remains the Key Pivot
At present, BTC/GOLD is trading below its 200-week moving average, sitting near 21.81. Historically, this level has acted as a momentum switch:
A weekly or monthly reclaim of this moving average would be a strong signal that buyers are stepping back in and that Bitcoin may begin outperforming gold once again.
If that happens, momentum could accelerate quickly.
What’s Next for Bitcoin (BTC)?
Back on the BTC/USD weekly chart, price is now pressing directly into the $69K–$74.5K demand zone, while also interacting with the rising moving average.
If bulls manage to:
-
Hold this $69K–$74.5K support band, and
-
Stabilize price back above the weekly moving average,
Bitcoin could attempt a recovery toward:
-
$97,900 (first major resistance)
-
$126,200 (cycle high resistance)
This would mark a classic support defense → relief rally structure.
On the flip side, a clean weekly close below $69K would weaken the rebound thesis and open the door to deeper consolidation or another downside leg before any sustainable recovery.
Bottom Line
While traditional safe havens like gold are seeing sharp rotations, Bitcoin is quietly holding a major long-term support zone.
At the same time:
-
BTC/USD is testing a historical demand area
-
BTC/GOLD is respecting its ascending triangle
-
Momentum is stretched after a 23% monthly drawdown
This combination often precedes medium-term bounce attempts.
If support near $69K–$74.5K holds and BTC/GOLD reclaims its 200-week moving average, Bitcoin could be entering a phase where it begins to shine again—right as broader market fear peaks.
For now, BTC sits at a crossroads.
The next few weekly closes may decide whether this is just another correction… or the foundation for the next leg higher.
Disclaimer: The views and analysis presented in this article are for informational purposes only and reflect the author’s perspective, not financial advice. Technical patterns and indicators discussed are subject to market volatility and may or may not yield the anticipated results. Investors are advised to exercise caution, conduct independent research, and make decisions aligned with their individual risk tolerance.
About Author: Nilesh Hembade is the Founder and Lead Author of Coinsprobe, with over 5 years of experience in the cryptocurrency and blockchain industry. Since launching Coinsprobe in 2023, he has been providing daily, research-driven insights through in-depth market analysis, on-chain data, and technical research.
Disclaimer: The information on this page may come from third parties and does not represent the views or opinions of Gate. The content displayed on this page is for reference only and does not constitute any financial, investment, or legal advice. Gate does not guarantee the accuracy or completeness of the information and shall not be liable for any losses arising from the use of this information. Virtual asset investments carry high risks and are subject to significant price volatility. You may lose all of your invested principal. Please fully understand the relevant risks and make prudent decisions based on your own financial situation and risk tolerance. For details, please refer to
Disclaimer.
Related Articles
Bitcoin reclaims $72K after US, Iran agree to 2-week ceasefire
Bitcoin surged past $72,000 after a two-week ceasefire between the US and Iran was announced. Traders often react positively to eased geopolitical tensions, despite overall market fear.
Cointelegraph16m ago
U.S. Spot Bitcoin ETFs See $471.3 Million Inflows Led by BlackRock
U.S. spot Bitcoin exchange-traded funds (ETFs) experienced substantial inflows at the beginning of the week, marking the strongest single-day performance in over six weeks. On Monday, Bitcoin ETFs attracted $471.3 million in net inflows. This surge reversed the previous month’s outflows and
CryptoBreaking18m ago
Iran’s Bitcoin hashrate falls 77% over the past quarter amid conflict
Iran’s hashrate has plummeted over the past quarter amid an ongoing conflict with the US and Israel, though the war itself has not dragged down global hashrate, according to a new report from Hashrate Index.
Iran has lost roughly 7 exahashes per second (EH/s) quarter-over-quarter, said Ian
Cointelegraph25m ago
BlackRock withdrew 2,607 BTC and 28,391 ETH from a certain CEX, for a total value of approximately $237 million
Gate News message: On April 8, according to monitoring by Onchain Lens, BlackRock withdrew 2,607 BTC from a certain CEX, worth approximately $178 million. It also withdrew 28,391 ETH, worth approximately $59 million.
GateNews25m ago
Trader “set 10 big targets first,” closed BTC and ETH long positions, with cumulative profits exceeding $12 million
Gate News message, April 8, the trader "set 10 big goals first" (@Jason60704294) disclosed on social media that he has closed out his BTC and ETH long positions, choosing to take profit and exit. In this trade, his 4x leverage long on BTC generated a profit of about $12.12 million, and his 2x leverage long on ETH generated a profit of about $728k, for a total profit of more than $12 million.
GateNews47m ago
Bitcoin vaults past $72,000 as U.S. stock futures surge on a two‑week U.S.–Iran ceasefire
Bitcoin and U.S. stocks surged following Trump's announcement of a two-week ceasefire with Iran, while oil prices fell sharply. The easing geopolitical tensions led to increased risk appetite, resulting in significant liquidations of leveraged crypto futures positions.
CoinDesk56m ago
