In the cryptocurrency market, “bottom fishing” is an extremely tempting yet highly risky game. If you are also passionate about identifying market turning points, this on-chain indicator that has been validated through multiple bull and bear cycles may become your “North Star” for accurately pinpointing bottoms in a bear market.
This indicator is called “Bitcoin Profit and Loss Supply,” primarily used to measure the overall profit and loss status of coin holders in the market — how many Bitcoins are still showing gains on paper, and how many are trapped in unrealized losses.

Historical data repeatedly proves that when the “Profit Bitcoin Supply” and the “Loss Bitcoin Supply” approach balance, or even intersect on the chart, it often signals that the bear market bottom has formed, indicating that the market has entered the final phase of “capitulation selling,” and the long-term investment window is opening.
For bullish investors hoping for a return to a bull market, good news may be just around the corner. Data shows that the number of profit chips and loss chips is trending toward an imminent “crossover.”
According to Glassnode statistics, approximately 11 million Bitcoins are currently in profit, meaning their holding costs are below the current market price; meanwhile, about 8.9 million Bitcoins are in loss. The gap between the two is narrowing, and if this convergence trend continues, it could replay the bottoming scripts seen in 2022 and 2018-19.
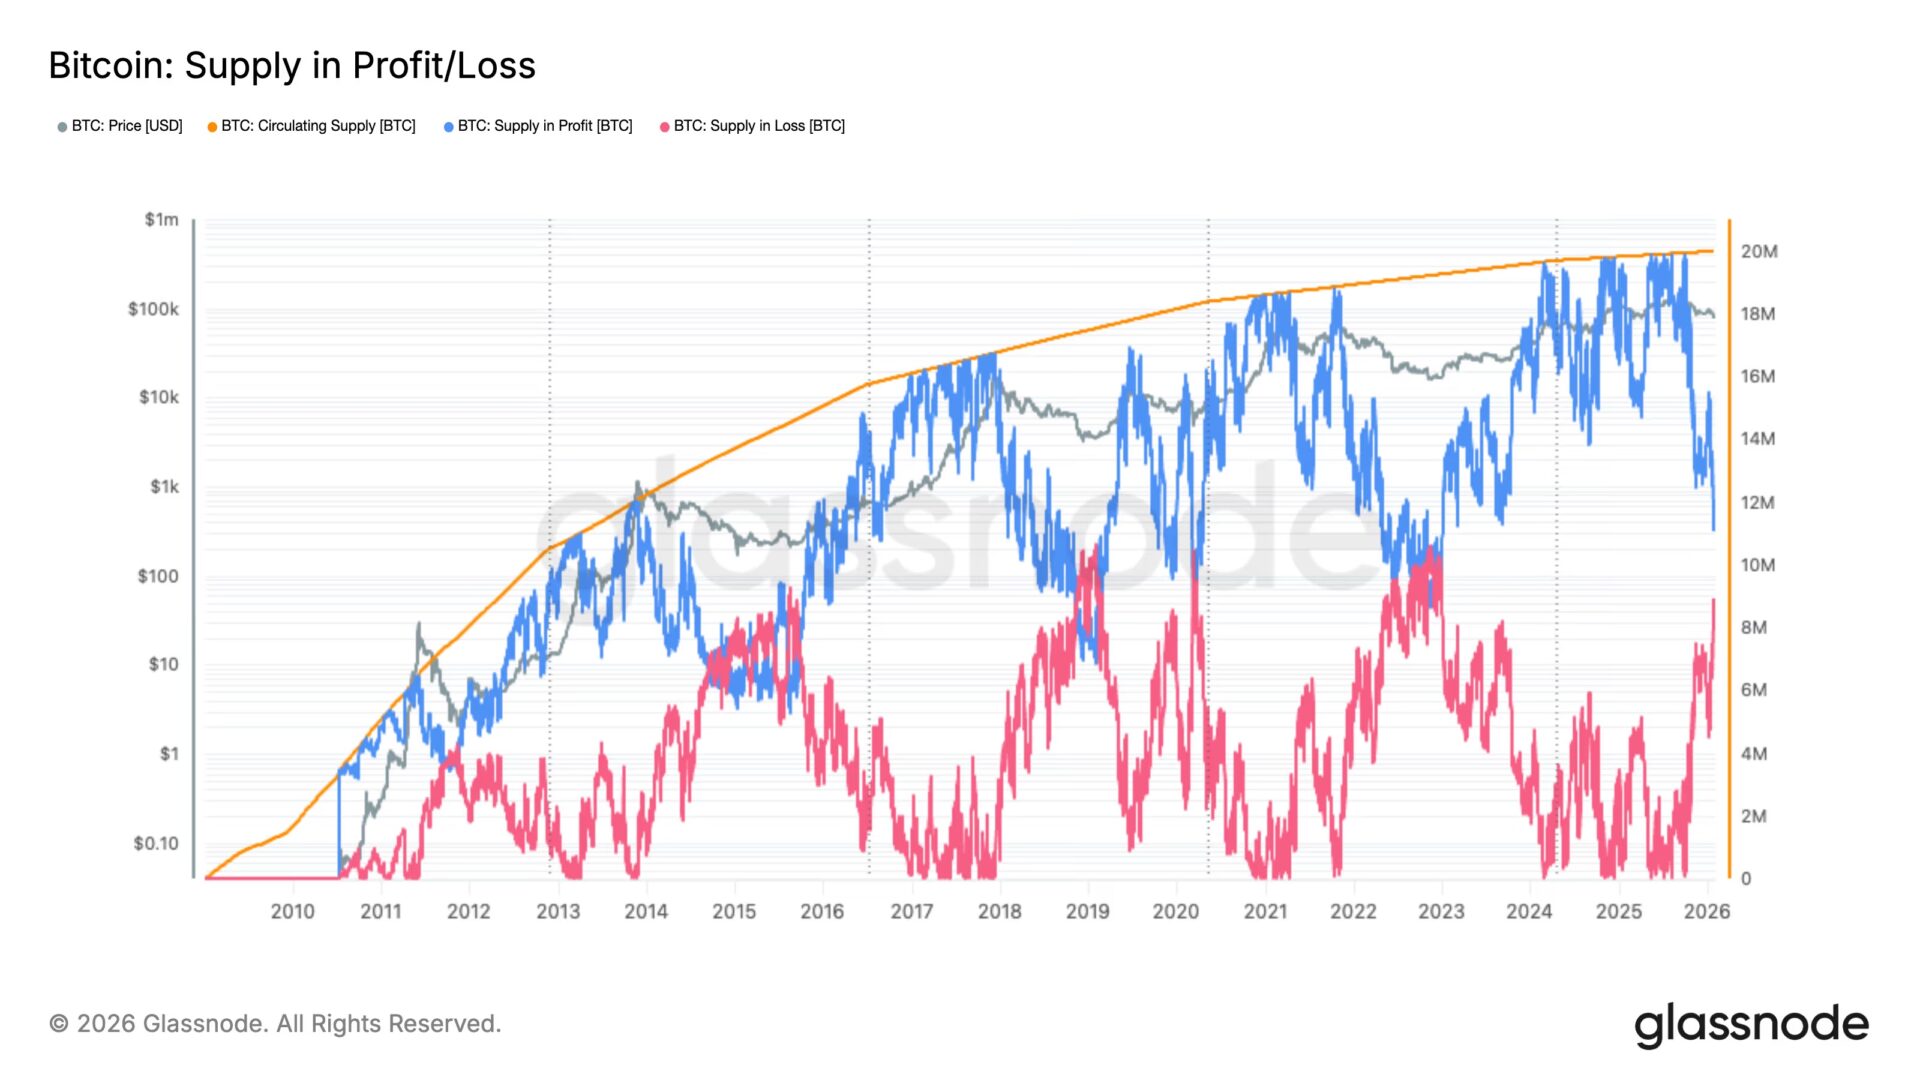
In Glassnode’s analysis chart, the blue line represents the “Profit Supply,” while the red line indicates the “Loss Supply.”
When Bitcoin’s spot price fluctuates around the overall cost basis of investors’ holdings, the chips will flow between these two camps. By observing the growth and decline of these two lines, we can gain deep insights into the market’s holding structure and the stress test faced by investors.
Looking back at past cycles, the “crossover points” of these two lines have often precisely marked the bear market bottoms:
- November 2022: During the panic caused by the collapse of the FTX exchange, Bitcoin dropped to around $15,000, and the indicator showed a crossover, followed by a market bottom and rebound.
- March 2020: The COVID-19 pandemic triggered a global liquidity crisis, causing Bitcoin to briefly fall below $3,000, with the indicator also signaling strongly.
- January 2019: During a prolonged winter of bear markets, Bitcoin fell to around $3,300, and the indicator once again confirmed the bottom.
- 2015: In early market cycles, Bitcoin also exhibited similar structures when trading above $200.
Disclaimer: The information on this page may come from third parties and does not represent the views or opinions of Gate. The content displayed on this page is for reference only and does not constitute any financial, investment, or legal advice. Gate does not guarantee the accuracy or completeness of the information and shall not be liable for any losses arising from the use of this information. Virtual asset investments carry high risks and are subject to significant price volatility. You may lose all of your invested principal. Please fully understand the relevant risks and make prudent decisions based on your own financial situation and risk tolerance. For details, please refer to
Disclaimer.
Related Articles
River (RIVER) Price Keeps Pumping as TD Indicator Signals Another Rally
Analyst Ali Martinez highlights the accuracy of the TD Sequential indicator in predicting River (RIVER) price movements. The indicator has consistently identified significant buy and sell signals throughout RIVER's volatility, suggesting potential future trends based on current signals.
CaptainAltcoin1h ago
ETH 15-minute decline of 0.88%: Capital outflow dominates market, intensifying short-term selling pressure
On March 22, 2026, from 21:00 to 21:15 (UTC), Ethereum (ETH) recorded a -0.88% return rate within 15 minutes, with the price fluctuating in the range of 2029.54 to 2060.75 USDT, reaching an amplitude of 1.52%. Market attention has increased, short-term volatility has significantly intensified, reflecting rapid conversion of funding pressure into price pressure.
The main driver of this anomaly is accelerated capital outflows from trading platforms: approximately 420,690 USD equivalent of ETH flowed in within 10 minutes, but the number of withdrawals reached 2,319 transactions in the past 1 hour, far exceeding deposits during the same period by 5
GateNews2h ago
BTC Drops 0.58% in 15 Minutes: Tight Liquidity and Institutional Hedging Create Downward Pressure
2026-03-22 21:00 to 21:15 (UTC), BTC recorded a -0.58% return within just 15 minutes, with prices fluctuating in the range of 67562.1 to 68223.5 USDT, with an amplitude of 0.97%. During this period, market sentiment was highly tense, overall attention increased, and short-term volatility accelerated noticeably.
The main driving force behind this anomaly was the resonance formed by spot market liquidity shortage and medium-sized funds accelerating their exit. On-chain data shows a significant net outflow of -371.99 BTC in the $100k-$1M transaction range, driving selling
GateNews2h ago
Risk-Off Drips throughout Markets
Geopolitical tensions and rising uncertainty have led to a risk-off sentiment in global markets, with investors moving away from assets like Bitcoin and Ethereum. High oil prices and inflation concerns influenced portfolio adjustments, while Bitcoin selling pressure increased as short-term holders took profits. The market remains sensitive amid low sentiment.
CryptoBreaking2h ago
Bitcoin Has Stabilized, But Investors Are Paying Up for Downside Protection: VanEck
Bitcoin's volatility has decreased to around $70,000, but traders are still heavily investing in downside protection. Although premiums for puts have dropped, they remain high historically, suggesting caution among investors. This defensiveness may signal an impending price bottom, as similar market conditions in the past have led to recoveries.
Decrypt2h ago
