Bitcoin Cash (BCH) is currently one of the few cryptocurrencies in the top 10 with a weekly price chart trending upward. Meanwhile, BNB was once considered a potential next candidate but has been under heavy pressure, experiencing a 54% decline over the past four months.
In contrast, BCH has maintained trading within a stable range for nearly 20 months. The price range fluctuates from $272 to $640, offering many attractive opportunities for swing traders.
According to a report from Coinphoton, long-term investors expect this range’s high to be broken and turned into support before considering participation in a stronger bullish trend. Although buyers attempted a breakout in early January, this effort was unsuccessful due to a market-wide sell-off that caused the price to reverse and correct.
However, currently, the Bitcoin Cash network appears to be maintaining a stable state. The significant increase in transaction volume along with active whale movements recently indicates strong on-chain liquidity circulation.
Short-term traders focus on the middle of the range to predict the next move
Since the second week of October, BCH price has touched below the support level in the middle of the $456 range three times on the weekly timeframe. However, no weekly close has fallen below this level, keeping the outlook positive.
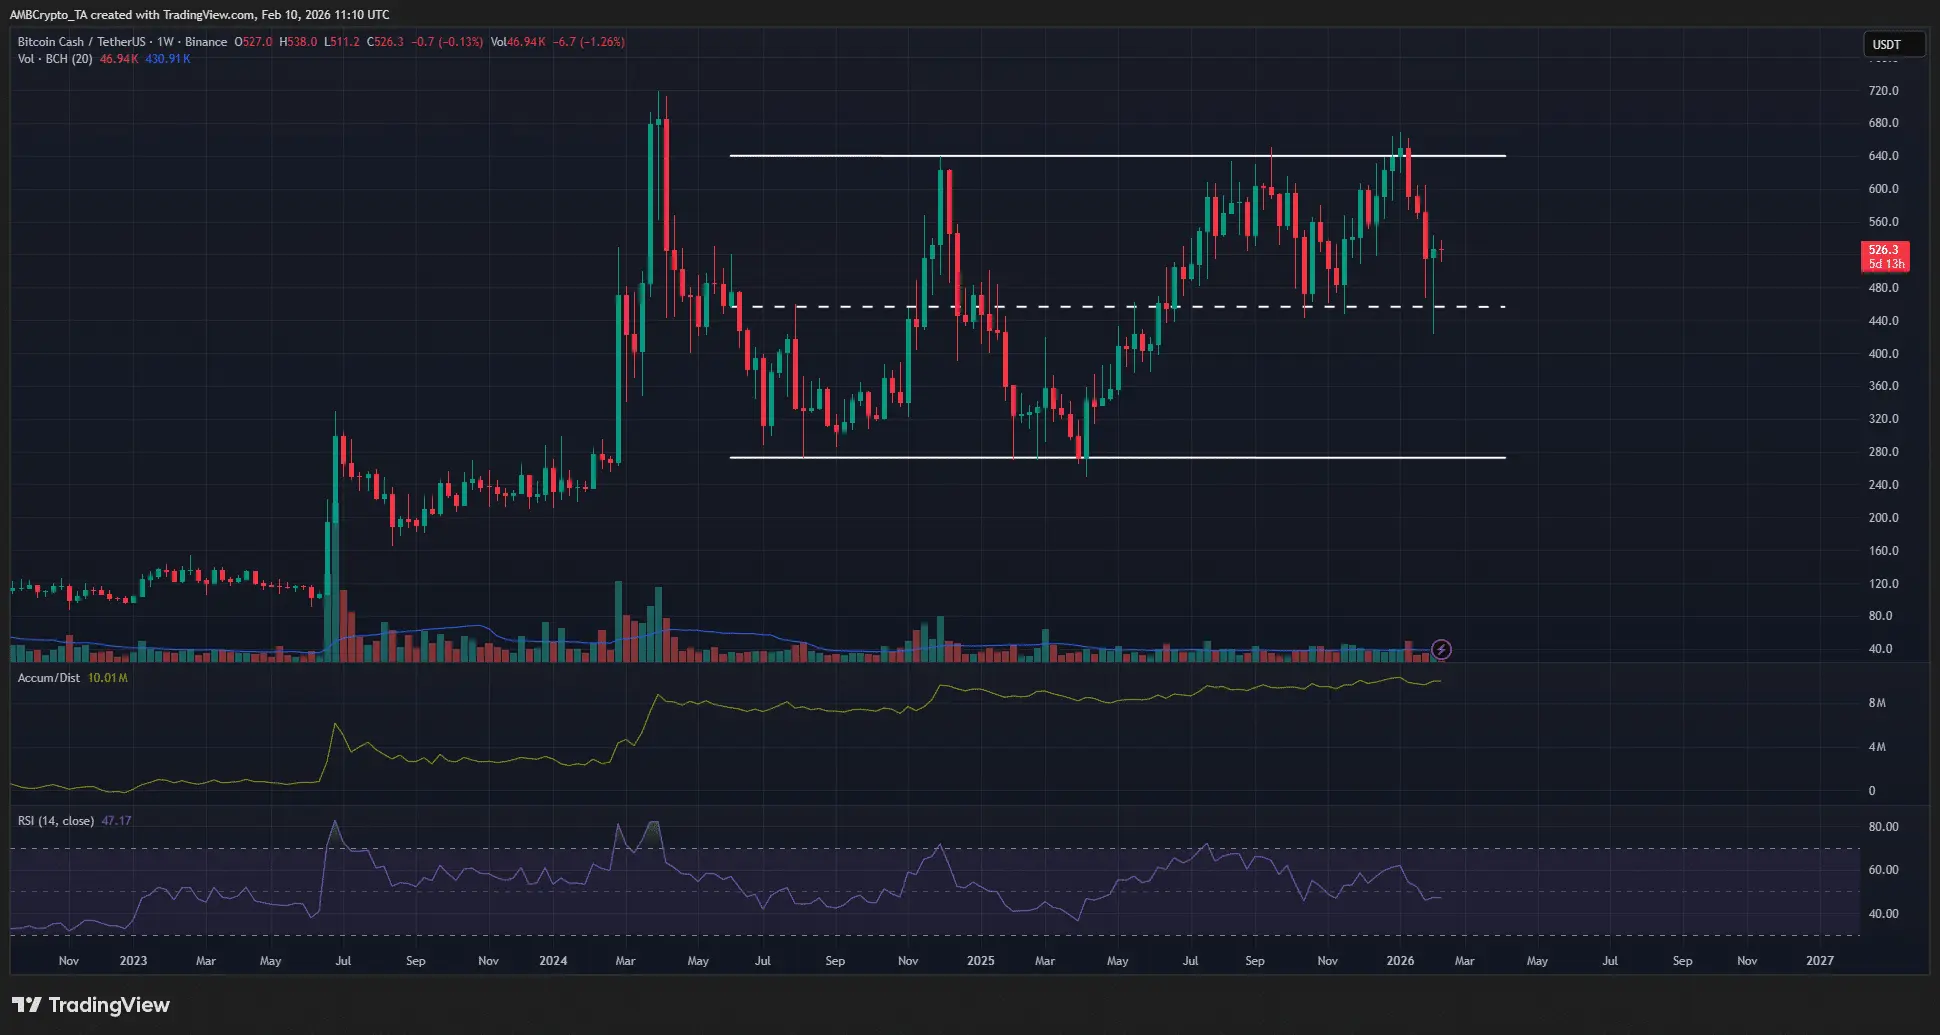 Source: TradingView The accumulation/distribution (A/D) indicator has maintained an upward trend since 2024, reflecting steady buying pressure. Additionally, the weekly RSI is currently at 47, indicating neutral momentum.
Combined with long-term price action, the $440–$460 zone is considered a low-risk, high-reward buying opportunity for investors.
Local supply zones may exert downward pressure
Liquidation heatmaps show that the $550 and $610 price levels are important nearby zones with significant potential to attract upward price movement before a reversal occurs. Notably, the supply zone at $550 has accumulated liquidity over the past 10 days.
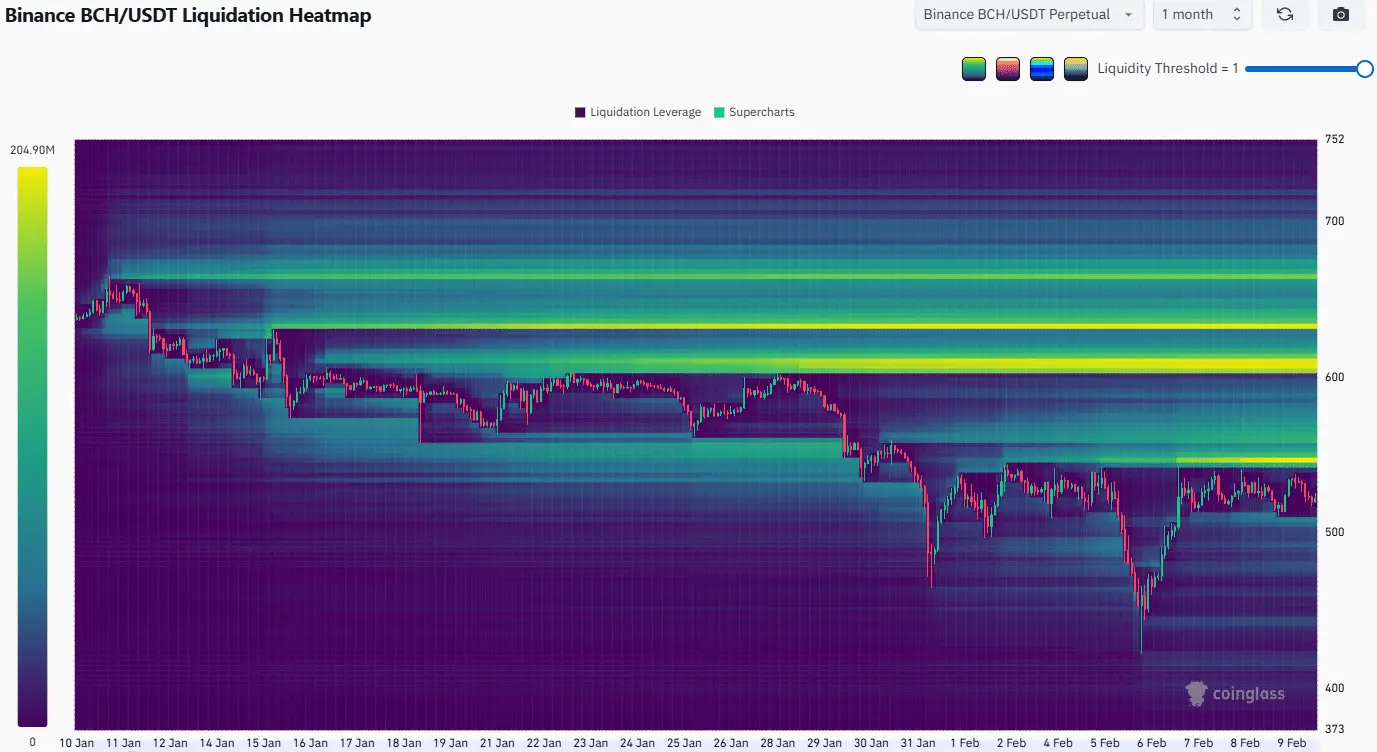 Source: CoinGlass Furthermore, the 4-hour chart indicates that BCH buyers have failed to break through the resistance at $540.
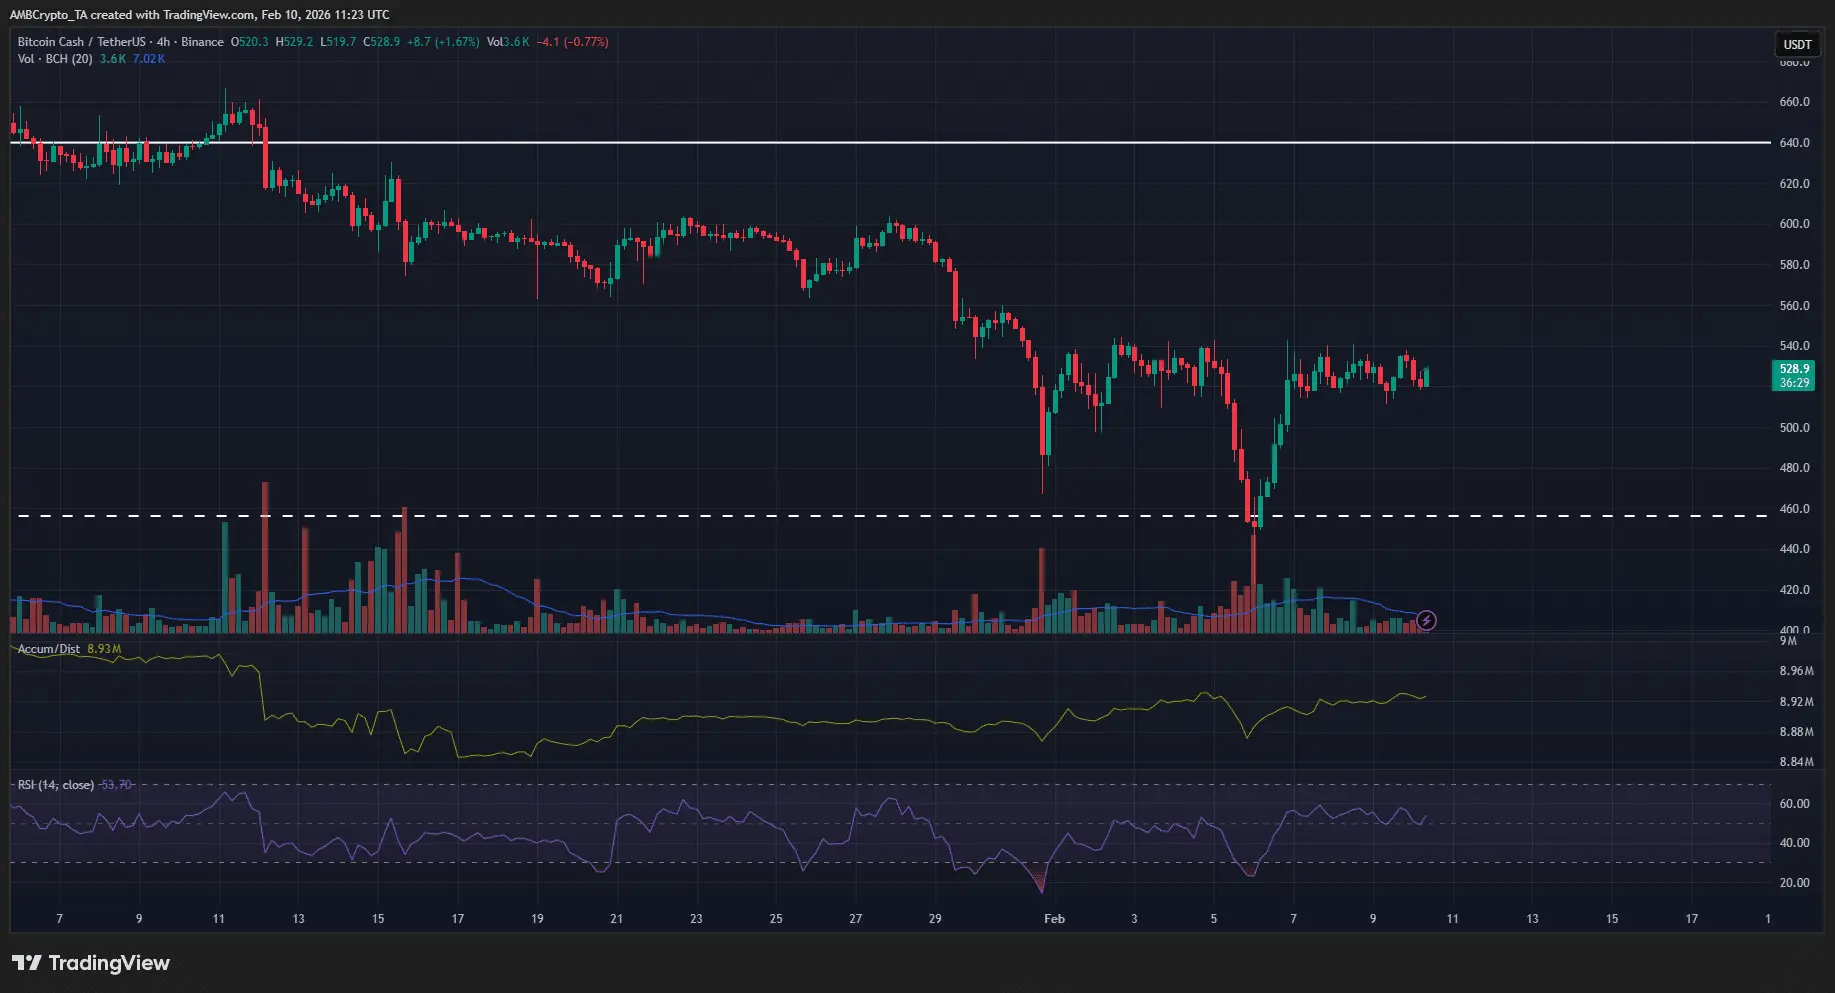 Source: TradingView Therefore, a possible scenario is that the price will be pushed higher in the short term to the $550–$560 zone before correcting downward to around $460. However, if BCH can break above $580, this scenario will be invalidated, opening the potential for a stronger rally.
Disclaimer: The information on this page may come from third parties and does not represent the views or opinions of Gate. The content displayed on this page is for reference only and does not constitute any financial, investment, or legal advice. Gate does not guarantee the accuracy or completeness of the information and shall not be liable for any losses arising from the use of this information. Virtual asset investments carry high risks and are subject to significant price volatility. You may lose all of your invested principal. Please fully understand the relevant risks and make prudent decisions based on your own financial situation and risk tolerance. For details, please refer to
Disclaimer.
Related Articles
Ethereum Approaches Cycle Low as Bitmain Indicates Violent Belief
The article explores Ethereum's potential market bottom, highlighting its correlation with past S&P 500 trends and significant institutional investment by Bitmain. Despite mixed market sentiment, historical patterns suggest possible recovery.
CryptoBreaking1h ago
Analyst: If Bitcoin falls below the $66,000 support level, it may trigger a 10%-20% correction
Gate News reported that on March 20, Chartered Market Technician (CMT) Aksel Kibar stated on March 21 that the lower support boundary of Bitcoin's potential rising wedge formation is located at 66,000, and a breakdown below this level could trigger a bearish reversal. Aksel Kibar pointed out that rising wedges, as a classic technical pattern, typically appear at the end of uptrends, signaling price momentum exhaustion. Historical data shows that after similar downside breakdowns are confirmed, the average pullback ranges from 10%-20%.
GateNews3h ago
Bitcoin Slips Below $70,000 as Fed Rate Pause and Oil Surge Pressure Markets
Bitcoin declined to $70,000 due to steady interest rates from the Federal Reserve and rising energy prices, leading to $600 million in liquidations and increased market volatility, particularly affecting altcoins.
CryptoBreaking3h ago
XRP Climbs 3% Past $1.47 as Breakout Extends on Bitcoin-Led Rally
Key Takeaways
XRP broke above $1.426 resistance after months of consolidation, jumping to $1.47 on surging volume
Trading volume spiked over 250% during the move, indicating strong participation in the breakout
Activity on the XRP Ledger continues climbing, with tokenized real-world assets
CryptoBreaking3h ago
