Trade
Basic
Futures
Futures
Hundreds of contracts settled in USDT or BTC
Options
HOT
Trade European-style vanilla options
Unified Account
Maximize your capital efficiency
Demo Trading
Futures Kickoff
Get prepared for your futures trading
Futures Events
Participate in events to win generous rewards
Demo Trading
Use virtual funds to experience risk-free trading
Earn
Launch
CandyDrop
Collect candies to earn airdrops
Launchpool
Quick staking, earn potential new tokens
HODLer Airdrop
Hold GT and get massive airdrops for free
Launchpad
Be early to the next big token project
Alpha Points
NEW
Trade on-chain assets and enjoy airdrop rewards!
Futures Points
NEW
Earn futures points and claim airdrop rewards
Investment
Simple Earn
Earn interests with idle tokens
Auto-Invest
Auto-invest on a regular basis
Dual Investment
Buy low and sell high to take profits from price fluctuations
Soft Staking
Earn rewards with flexible staking
Crypto Loan
0 Fees
Pledge one crypto to borrow another
Lending Center
One-stop lending hub
VIP Wealth Hub
Customized wealth management empowers your assets growth
Private Wealth Management
Customized asset management to grow your digital assets
Quant Fund
Top asset management team helps you profit without hassle
Staking
Stake cryptos to earn in PoS products
Smart Leverage
NEW
No forced liquidation before maturity, worry-free leveraged gains
GUSD Minting
Use USDT/USDC to mint GUSD for treasury-level yields
More
AYATTAC
#SpotGoldHitsaNewHigh 📉 The Macro "Perfect Storm"
The selling isn’t just about one tweet or one yield; it’s a global deleveraging event.
The Trump-Greenland Factor: The threat of a 10%–25% tariff on eight European nations starting February 1st has fundamentally shifted the 2026 outlook. It’s no longer just "rhetoric"—markets are pricing in a direct hit to global GDP and a potential retaliatory trade war.
The "Japanese Earthquake": For decades, Japan has been the world's source of cheap capital. With 40-year yields hitting 4% for the first time since 2007, that "carry trade" is unwinding. Wh
BTC-2,02%

- Reward
- 5
- 7
- Repost
- Share
AngelEye :
:
Buy To Earn 💎View More
January 21 BTC Technical Analysis
- Core conclusion: Daily chart is bearish, short-term weak oscillation; watch for breakthroughs/breakdowns of key support and resistance levels. If rebound is weak, the downtrend will continue.
- Current price: $88,950 (24h range $87,902-$92,501, down -3.83%).
Key Levels and Indicators
- Daily: Price broke below EMA20 ($91,890) and the 100-day moving average, RSI at 41.81 indicating neutral to weak momentum, MACD dead cross with increasing volume, trend weakening.
- 12h: Retraced to the 0.618 Fibonacci level at $87,200, combined with weekly moving averages sup
BTC-2,02%
- Reward
- 2
- 2
- Repost
- Share
CryptoVortex:
Buy To Earn 💎View More
MODAL TRADING | WIN GOLD! | 2026 CAN YOU CLAIM THIS?! via @YouTube
#Gate #TradFi #Gold #CrossEx
View Original#Gate #TradFi #Gold #CrossEx
- Reward
- 1
- 1
- Repost
- Share
Ryakpanda:
2026 Go Go Go 👊THEWEEKND
THEWEEKND
Created By@LonelyLiangxi
Listing Progress
0.00%
MC:
$3.36K
Create My Token
#JoinGateTradFitoWinGoldPack oycxyiyi8y8yf8y8y99f9yoy8f8yiyiyoy9yfy9y9y9y9y9y9yy9y9yyy9yyyf6fyfyfyf667769yfy9y9oyyfyooyoyyoyofyoyoofyoyooyyoyooyoyyoyoyo

- Reward
- like
- Comment
- Repost
- Share
4 years ago, someone bought this JPEG for $70M
Today, it’s worth $19K
#NFTs #Crypto #MarketReality #Cryptera
Today, it’s worth $19K
#NFTs #Crypto #MarketReality #Cryptera

- Reward
- 2
- Comment
- Repost
- Share
Gate Annual Report is out! Let's take a look at my yearly performance
Click the link to view your exclusive #2025Gate年度帳單 and receive a 20 USDT position experience voucher https://www.gate.com/zh-tw/competition/your-year-in-review-2025?ref=XgNCBlA&ref_type=126&shareUid=UVJCU1hY
View OriginalClick the link to view your exclusive #2025Gate年度帳單 and receive a 20 USDT position experience voucher https://www.gate.com/zh-tw/competition/your-year-in-review-2025?ref=XgNCBlA&ref_type=126&shareUid=UVJCU1hY

- Reward
- like
- Comment
- Repost
- Share
🔹 Tariff threats resurface! Crypto market flashed down overnight – can BTC hold?
314
- Reward
- like
- Comment
- Repost
- Share
see you all later today for intern office hours!\n\n🕐 14:00 UTC\n\nheads up: there\'s a new google meet link so you need to register below to join 👇\n🔗

- Reward
- like
- Comment
- Repost
- Share
Gate Live Live Mining Plan | Host Rebate Up to 10%
🎥 Start mining immediately when live, earnings settled weekly, earn while streaming!
✨ Exclusive benefits for hosts
✅ VIP Green Channel Accelerated Level Up
✅ Monthly prize pool of $10,000–$100,000 to be shared
✅ Exclusive airdrops, follower growth incentives, limited merchandise
✅ New host first broadcast rebate doubled → Up to 20%
🚀 Start live now: https://www.gate.com/live/apply
📄 Event details: https://www.gate.com/announcements/article/29920
View Original🎥 Start mining immediately when live, earnings settled weekly, earn while streaming!
✨ Exclusive benefits for hosts
✅ VIP Green Channel Accelerated Level Up
✅ Monthly prize pool of $10,000–$100,000 to be shared
✅ Exclusive airdrops, follower growth incentives, limited merchandise
✅ New host first broadcast rebate doubled → Up to 20%
🚀 Start live now: https://www.gate.com/live/apply
📄 Event details: https://www.gate.com/announcements/article/29920

- Reward
- 4
- 4
- Repost
- Share
金马币发起共识者 :
:
Hold on tight, we're about to take off 🛫View More
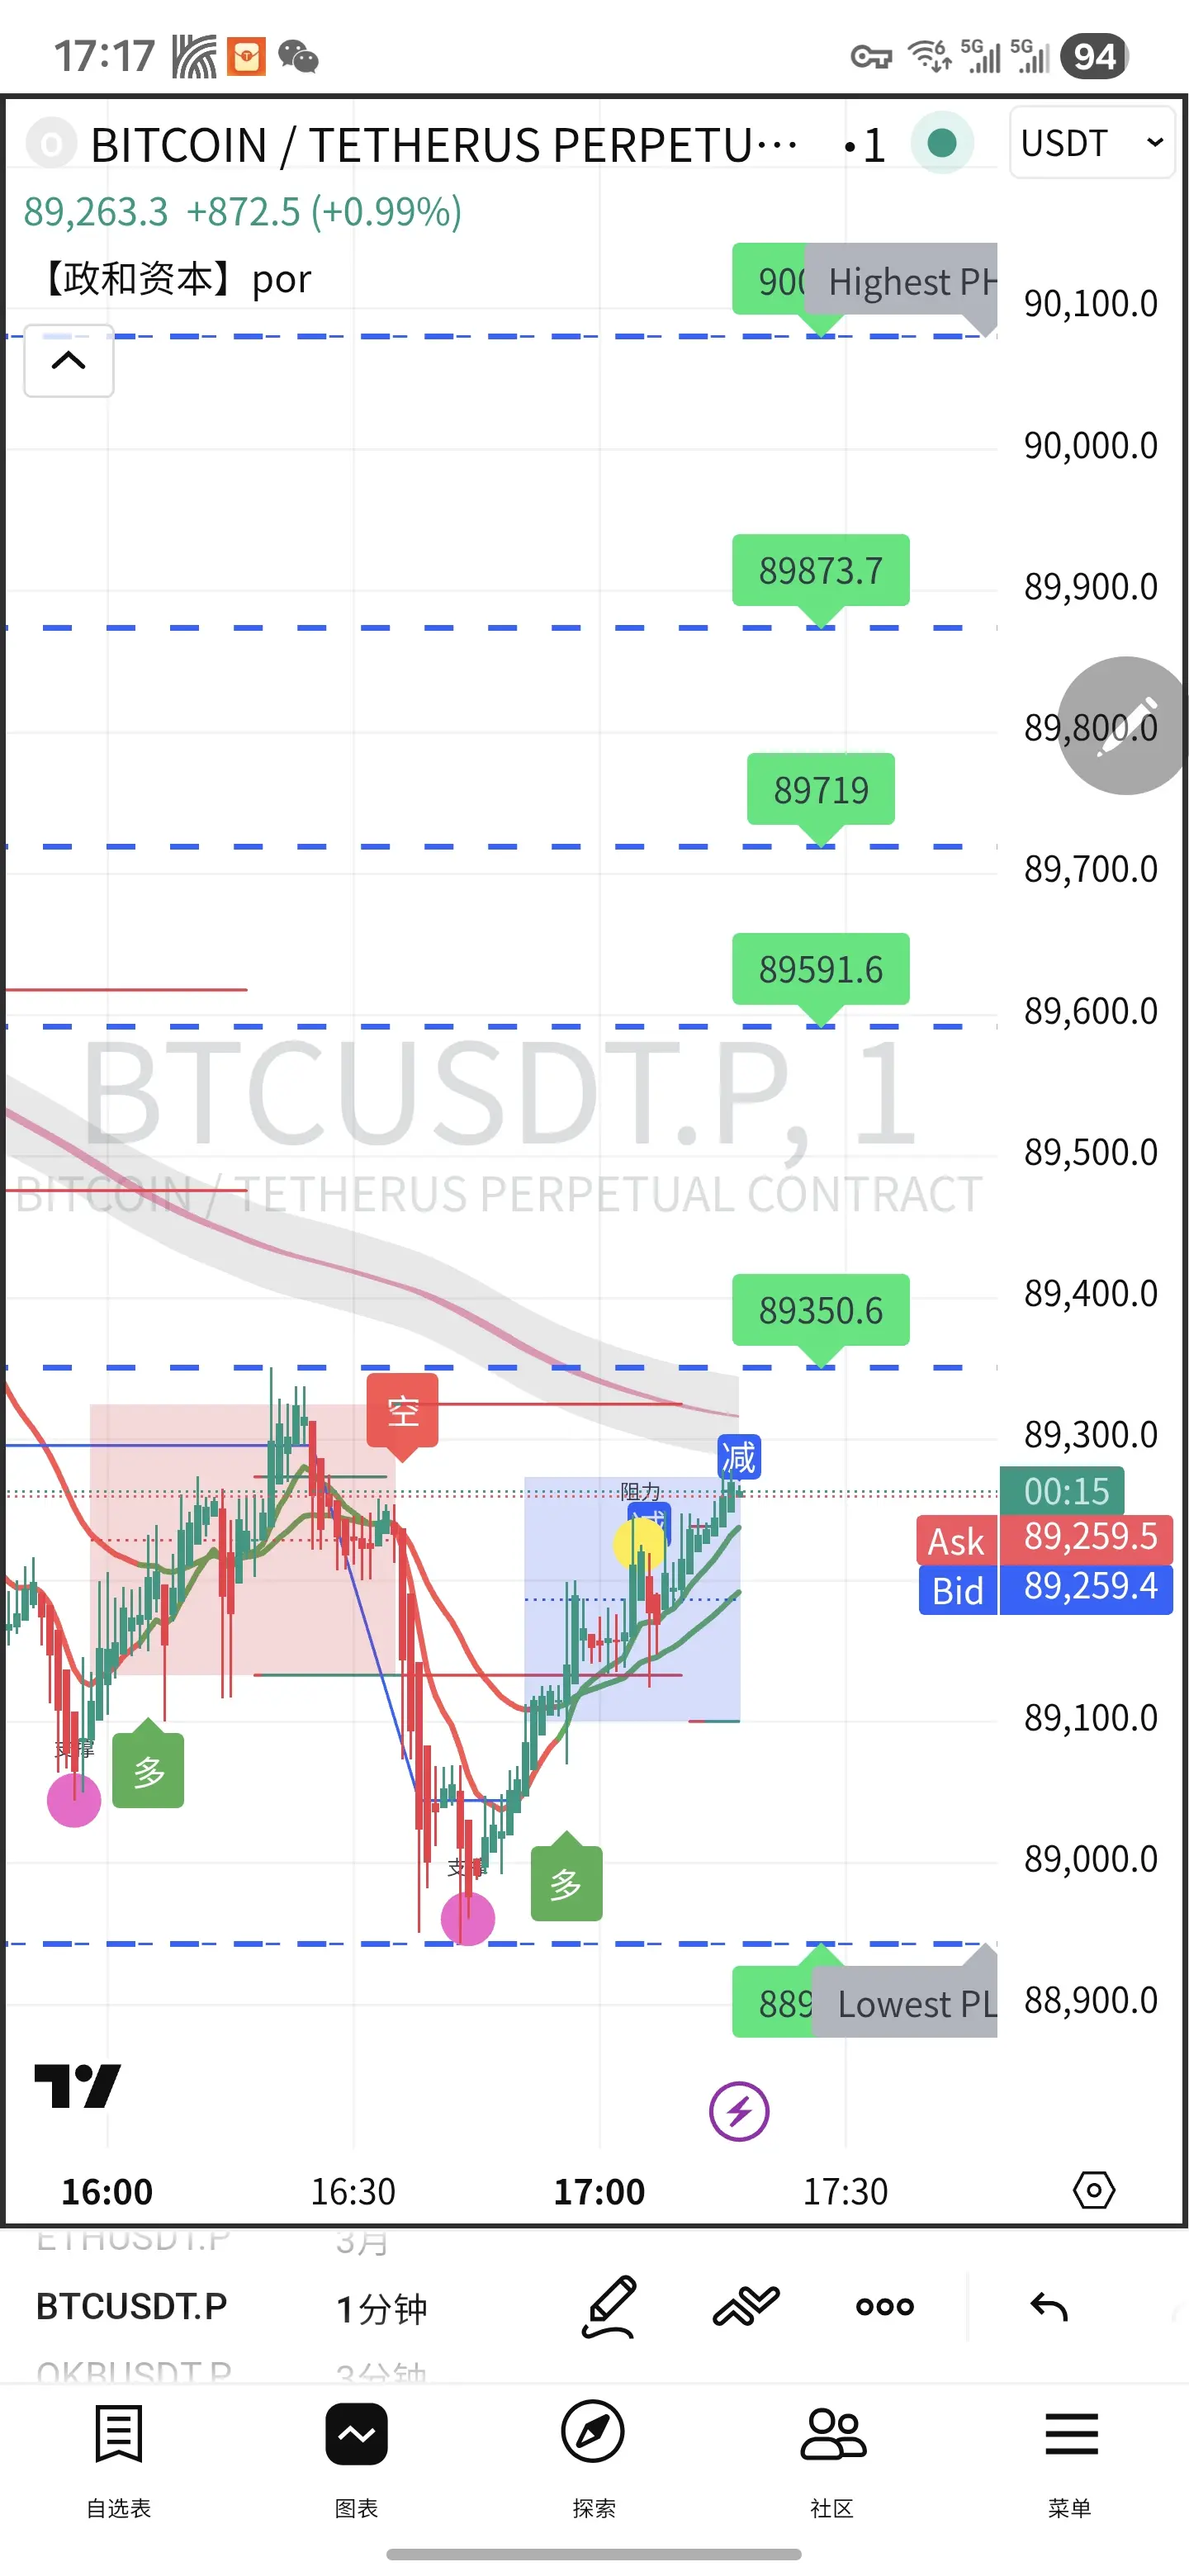
Currently, the oscillating market is severely oversold. Let's see if the night session provides an opportunity. Ethereum at 2890, Bitcoin around 89000, consider jumping in~
View Original
- Reward
- like
- Comment
- Repost
- Share
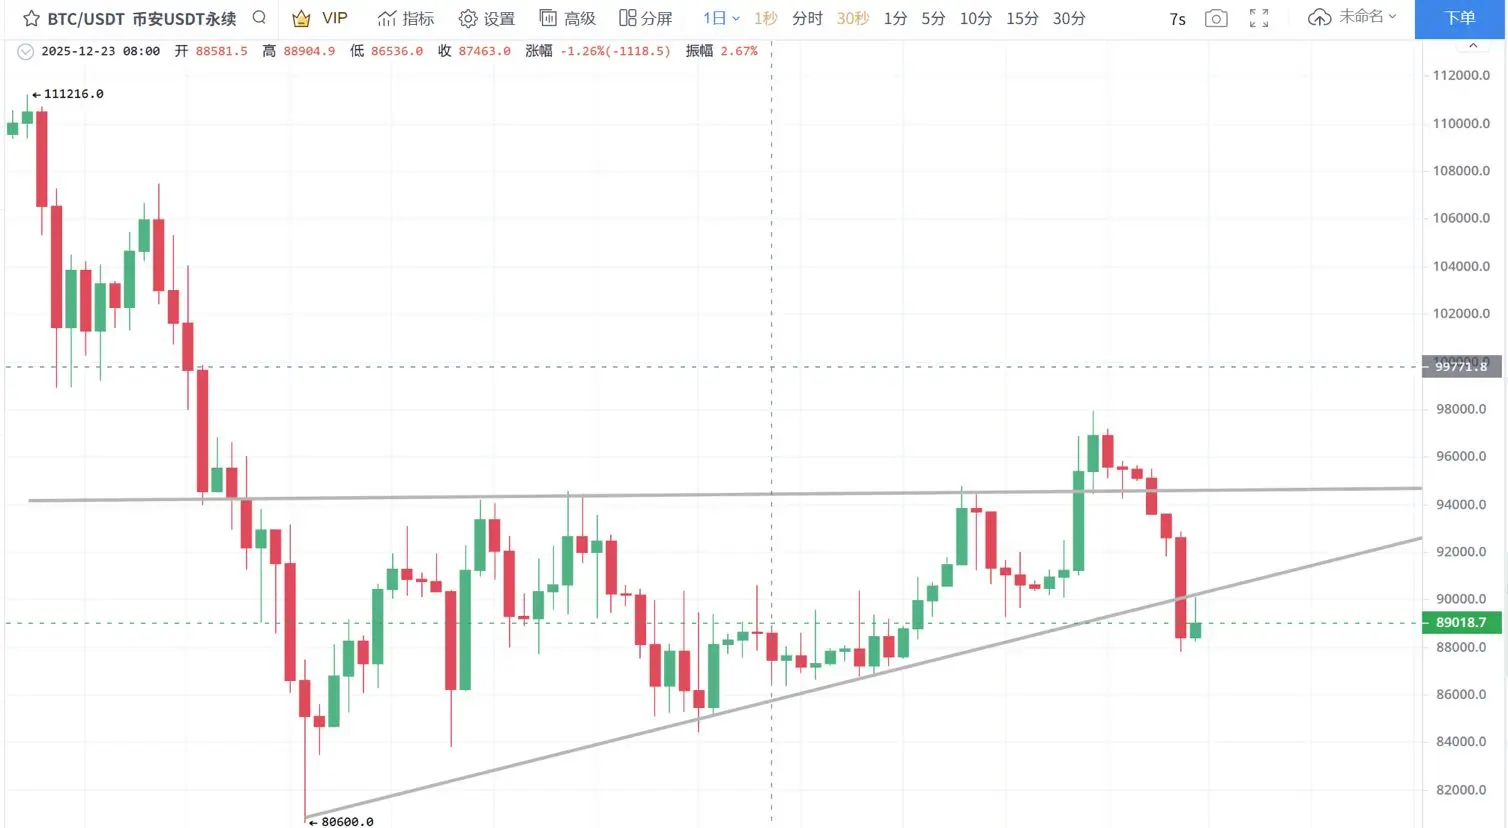
【ETH low buy high sell steady as a rock! BTC loses 90,000, hanging on the edge of life and death】
I have fully exited my ETH positions when the price touched the two highs of 3370 USD and 3308 USD. Last night, I gradually added back ETH spot positions at the levels of 3086 USD and 3026 USD, while directly placing a hard stop-loss order at 2900 USD.
From the market trend, BTC has already broken below the daily ascending channel support level of 90,000 USD. If the daily close tomorrow morning fails to regain the 90,000 USD level, market risk will further increase. Therefore, I have preemptively
View OriginalI have fully exited my ETH positions when the price touched the two highs of 3370 USD and 3308 USD. Last night, I gradually added back ETH spot positions at the levels of 3086 USD and 3026 USD, while directly placing a hard stop-loss order at 2900 USD.
From the market trend, BTC has already broken below the daily ascending channel support level of 90,000 USD. If the daily close tomorrow morning fails to regain the 90,000 USD level, market risk will further increase. Therefore, I have preemptively
- Reward
- like
- Comment
- Repost
- Share
I think he is referring to myself.
- Reward
- like
- Comment
- Repost
- Share
🔥 Watch-to-Earn Episode 15 officially begins! The prize pool has been upgraded!
🎁 This episode's super prizes:
Burberry Cashmere Scarf|GT|Spring Festival Gift Box|$50 Position Experience Voucher|Plus token lucky bag with 100% winning chance
📈 Last episode's heat value can be accumulated and used in this episode
Watch live streams, comment and interact, check in, and make reservations to exchange heat value for lottery chances
80 heat value = 1 lottery chance, it's never too late to join, the next lucky winner could be you!
👉 Join now & accumulate points:
https://www.gate.com/activities/wa
GT-1,1%

- Reward
- 5
- 4
- Repost
- Share
Ryakpanda:
2026 Go Go Go 👊View More
星星之火
星星之火
Created By@gatefunuser_936d
Listing Progress
100.00%
MC:
$4.96K
Create My Token
- Reward
- like
- Comment
- Repost
- Share
Even if you have zero followers \n\nSay Hi, that’s how connection starts\n\nWe will follow you ✅

- Reward
- like
- Comment
- Repost
- Share
January 21, 2026
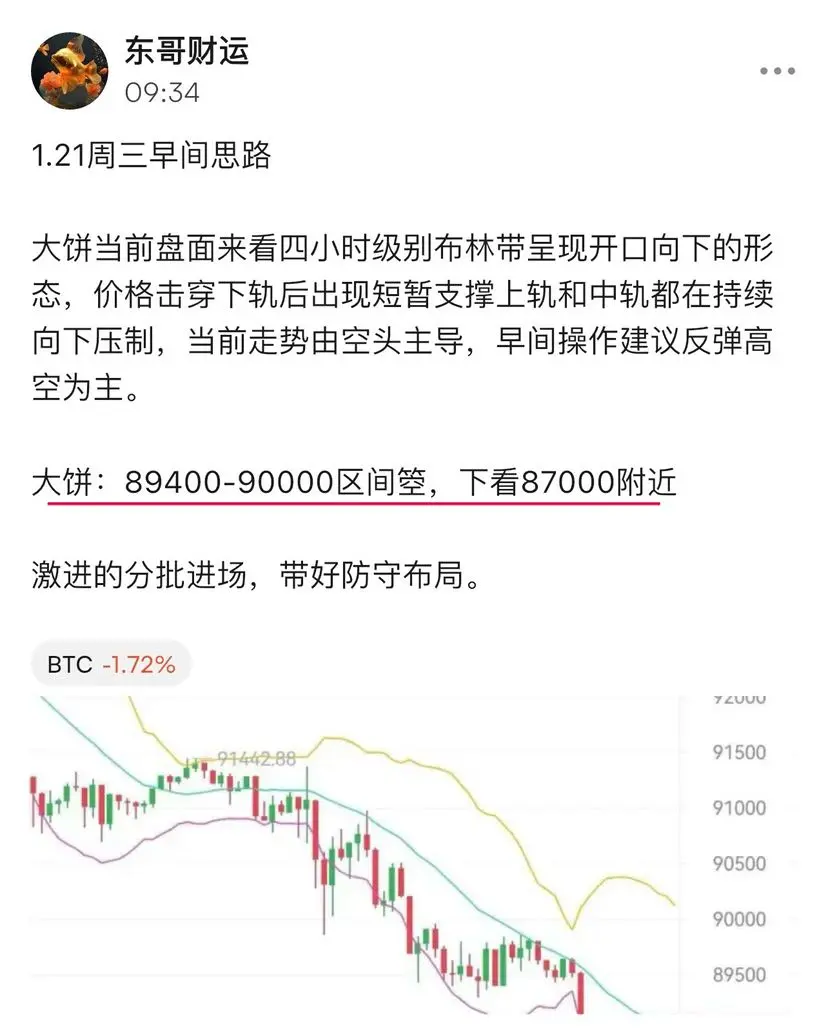
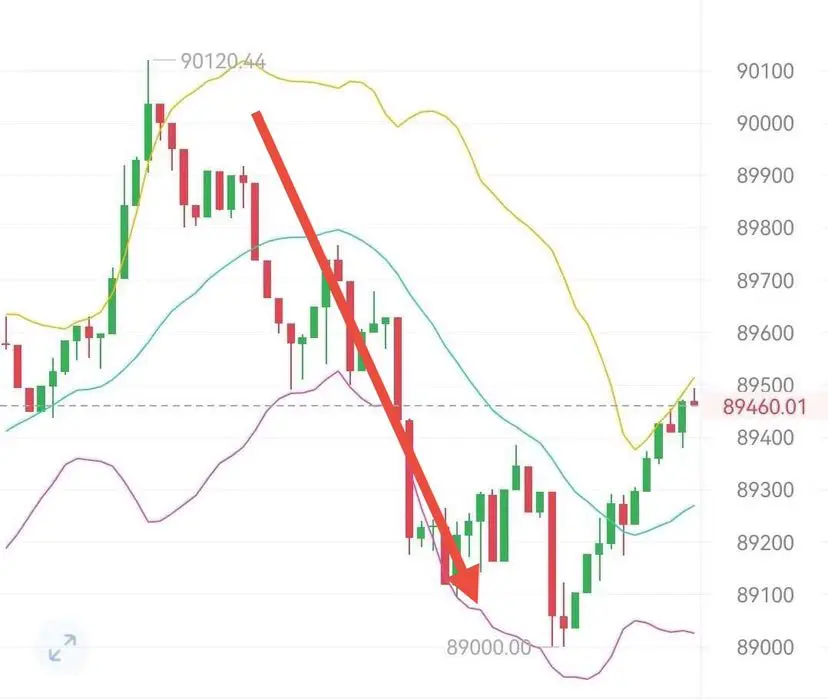
Recently, Bitcoin experienced a sharp decline with a large bearish candle, rapidly dropping from around 92,000 to approximately 87,500. The bears were very aggressive, and the fall was both fast and fierce; now it’s fluctuating between 87,500 and 89,500. The candlestick pattern is a combination of small bullish candles, doji stars, and small bearish candles, with no large bullish candles to push prices higher or large bearish candles to continue the decline—it's just a tired decline, with bulls and bears temporarily unable to gain the upper hand. This is a low-level consolidat
Recently, Bitcoin experienced a sharp decline with a large bearish candle, rapidly dropping from around 92,000 to approximately 87,500. The bears were very aggressive, and the fall was both fast and fierce; now it’s fluctuating between 87,500 and 89,500. The candlestick pattern is a combination of small bullish candles, doji stars, and small bearish candles, with no large bullish candles to push prices higher or large bearish candles to continue the decline—it's just a tired decline, with bulls and bears temporarily unable to gain the upper hand. This is a low-level consolidat
BTC-2,02%

- Reward
- 1
- 1
- Repost
- Share
金马币发起共识者:
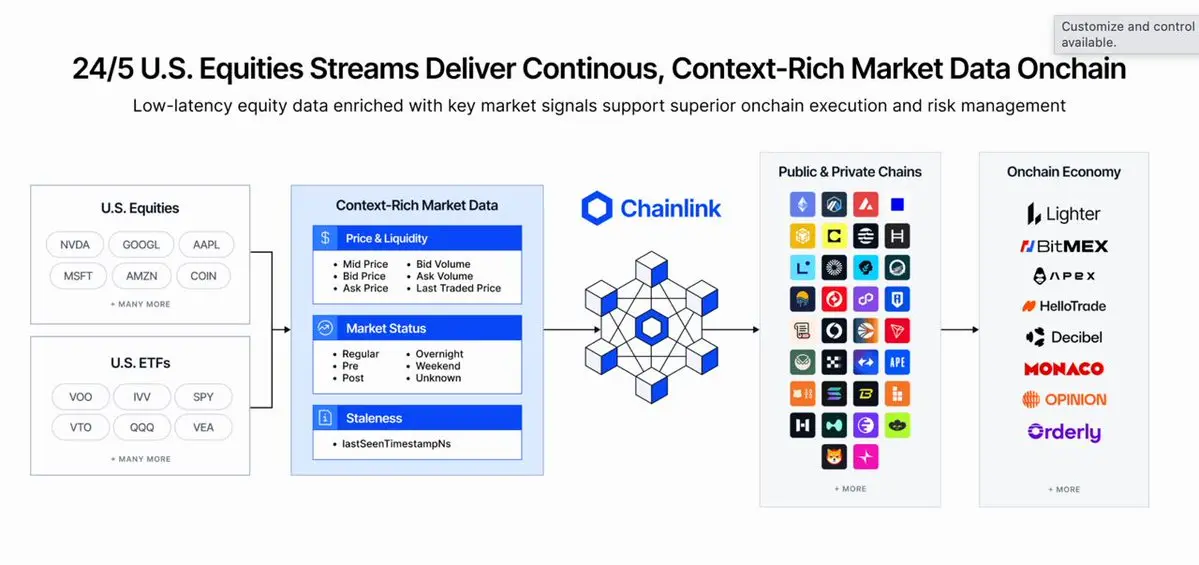
New Year Wealth Explosion 🤑🇺🇸 NEW: Chainlink has launched 24/5 U.S. equities data streams, bringing continuous onchain access to U.S. stocks and ETFs tied to the $80T equity market.
LINK-1,67%
- Reward
- 1
- 1
- Repost
- Share
Crypto_Exper:
Happy New Year! 🤑🇨🇳 NVIDIA Eyes a Return to China’s AI Market
NVIDIA CEO Jensen Huang is reportedly planning a visit to China in late January, signaling renewed efforts to re-engage with the country’s AI chip market. The trip is expected to include internal company events and potentially meetings in Beijing, with discussions focused on reopening sales channels for advanced AI hardware possibly including processors like the H200 ahead of the Lunar New Year.
The move comes as NVIDIA navigates shifting U.S. export restrictions while balancing its long-term strategy in China’s rapidly expanding technology and A
- Reward
- like
- Comment
- Repost
- Share
CFTC moves! Crypto lawyer Passalacqua takes office, signaling
559
- Reward
- 1
- Comment
- Repost
- Share
Join the contest and get delicious rewards!!!!
https://www.gate.com/activities/watch-to-earn/?now_period=15&refUid=34884557
View Originalhttps://www.gate.com/activities/watch-to-earn/?now_period=15&refUid=34884557


Where will Bitcoin go!!
up
down
0 ParticipantsEnds In 22 Hour
- Reward
- 1
- Comment
- Repost
- Share
Load More
Join 40M users in our growing community
⚡️ Join 40M users in the crypto craze discussion
💬 Engage with your favorite top creators
👍 See what interests you
Trending Topics
View More26.52K Popularity
8.19K Popularity
512 Popularity
47.42K Popularity
341.18K Popularity
Hot Gate Fun
View More- MC:$3.45KHolders:20.15%
- MC:$3.42KHolders:20.06%
- MC:$3.39KHolders:10.00%
- MC:$3.38KHolders:10.00%
- MC:$3.38KHolders:10.00%
News
View MoreData: If ETH breaks through $3,110, the total liquidation strength of mainstream CEX short positions will reach $1.494 billion.
1 m
Data: The probability of Bitcoin reaching $100,000 in January on Polymarket has dropped to 7%.
2 m
Chairman of the Russian Energy Committee: Illegal crypto mining causes approximately $250 million in losses to Russia annually
4 m
Bitpanda plans to launch a unified investment platform integrating stocks, ETFs, and cryptocurrencies
12 m
Zcash Foundation Adds Rust Version DNS Seed Servers to Improve Network Reliability
27 m
Pin