Date: Sun, Dec 21 2025 | 08:56 AM GMT
The broader cryptocurrency market has remained under pressure over the past several weeks, following the sharp sell-off that began on October 10. That corrective phase dragged Ethereum (ETH) down by nearly 23% over the last 60 days and weighed heavily on overall market sentiment. While many altcoins have struggled to stabilize, Quant (QNT) has shown relative resilience, posting only a modest decline and holding above a historically important support zone.
From a technical perspective, the daily chart suggests that QNT may be approaching a critical decision point, with price action forming a recognizable structure that could influence its next directional move.
Source: Coinmarketcap
Head and Shoulders Pattern Takes Shape
On the daily timeframe, QNT appears to be carving out a head and shoulders formation, a well-known pattern that often signals a potential trend shift once the neckline is tested. Earlier in the structure, QNT formed the left shoulder before rallying sharply to its head near the $100 region. From there, price reversed lower and slid back toward the neckline, located around the $70 support zone.
This $70 area has proven to be a strong demand zone in the past, repeatedly attracting buyers and preventing deeper declines. The recent move into this region was met with a noticeable reaction, as reflected by the long lower wick on the chart. That rejection from support pushed price back toward the $78 level, suggesting that buyers are actively defending the neckline and potentially forming the right shoulder of the pattern.
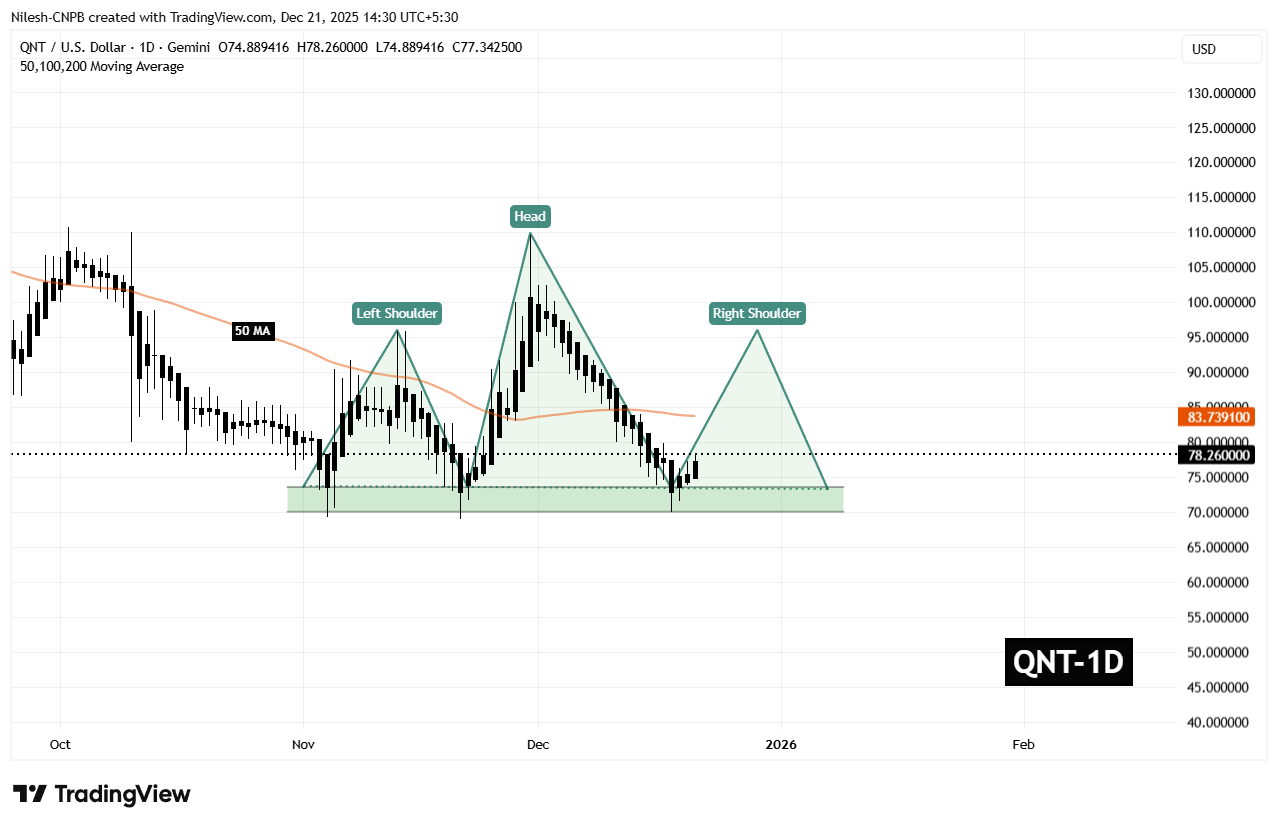
Quant (QNT) Daily Chart/Coinsprobe (Source: Tradingview)
The behavior around this zone is critical. A successful defense of the neckline often opens the door for a relief rally, especially if broader market conditions stabilize.
What’s Next for QNT?
For bullish momentum to build, QNT needs to reclaim the 50-day moving average, currently sitting near $83.73. This level now acts as a key short-term resistance, and a daily close above it would signal a shift in momentum back in favor of buyers.
If that recovery unfolds, the chart points toward a potential move into the $95.90 region. Such a move would represent a rebound of roughly 22% from current levels and align with the typical reaction seen during the right-shoulder phase of this pattern. A rally of this nature would not only ease recent selling pressure but also place QNT back into a more neutral technical posture.
That said, the setup remains delicate. If the $70 neckline support fails to hold on a sustained basis, the head and shoulders structure would remain bearish, opening the door to further downside and extending the corrective phase. For now, all eyes remain on how price behaves around this key support and whether buyers can regain control above the moving average.
Disclaimer: The views and analysis presented in this article are for informational purposes only and reflect the author’s perspective, not financial advice. Technical patterns and indicators discussed are subject to market volatility and may or may not yield the anticipated results. Investors are advised to exercise caution, conduct independent research, and make decisions aligned with their individual risk tolerance.
Disclaimer: The information on this page may come from third parties and does not represent the views or opinions of Gate. The content displayed on this page is for reference only and does not constitute any financial, investment, or legal advice. Gate does not guarantee the accuracy or completeness of the information and shall not be liable for any losses arising from the use of this information. Virtual asset investments carry high risks and are subject to significant price volatility. You may lose all of your invested principal. Please fully understand the relevant risks and make prudent decisions based on your own financial situation and risk tolerance. For details, please refer to
Disclaimer.
Related Articles
Japanese Yen Rate Hike Hopeless? Japanese Bonds Collapse with "Yields at 27-Year High," Strait of Hormuz Conflict Strangling Japan's Economy
Japan's 10-year government bond yield rose to 2.32%, approaching a 27-year high, with markets concerned that geopolitical tensions will impact the economy and crypto markets. Trump's 48-hour ultimatum to Iran has sent energy prices soaring, and Japan's critical crude oil shipping routes face threats, potentially worsening inflation. The Bank of Japan faces a dilemma between rate hikes and economic recovery, while rising yields could trigger investor liquidations, impacting risk assets like Bitcoin.
動區BlockTempo12m ago
Pi Network Price Surge Outpaces Market, Protocol 20 Upgrade Boosts Market Confidence
Pi Network's recent price has risen to $0.198, outperforming the broader crypto market, primarily driven by capital rotation and the launch of a new token platform developed through Protocol 20 upgrades. Analysts point out that PI's gains reflect fundamental improvements rather than passive market influences. Going forward, PI's price movement will be affected by altcoin season indices and market sentiment, with $0.20 serving as resistance and $0.19 as support.
MarketWhisper43m ago
XRP Today's News: SOPR Approaching Historical Signal of 1, Bottom Signal Emerging
XRP has continued to underperform since the start of the year, failing to attract market capital, with current trading prices below major moving averages. SOPR and NUPL indicators show bottom signals, but these are only probabilistic characteristics. $1.51 serves as a near-term bullish-bearish dividing line, with breakouts potentially triggering a bullish rebound. The market maintains a cautious stance on XRP's short-term strong rebound, with the probability of returning to $2 at only 5%.
MarketWhisper52m ago
Bitcoin Falls Below $69,000, Derivatives Market Shifts to Defense, Downside Risks Intensify
10x Research analysis points out that Bitcoin has broken below $69,000, marking a shift in market structure. Traders have significantly adjusted positions, with increased futures liquidations and negative funding rates. Options capital flows are moving toward downside protection, signaling hedging demand against downside risks. Meanwhile, market expectations regarding rate increases are diverging from the Federal Reserve's rate-cutting guidance, which could impact risk asset performance.
GateNews1h ago
Hyperliquid Surpasses CME Pricing Status, On-Chain Commodity Trading Volume Breaks $173.4 Billion
Hyperliquid's HIP-3 board has achieved billion in trading volume over the past 7 days, primarily driven by WTI crude oil contracts, demonstrating strong market activity. Powered by the US-Iran conflict, the platform's 24/7 trading functionality has made it an important source for price discovery, replacing traditional exchanges. As Hyperliquid adapts to CFTC regulations, it aims to maintain financial neutrality, but how to balance compliance requirements with the advantages of decentralized trading remains a challenge.
MarketWhisper1h ago
Gate Daily Report (March 23): MicroStrategy Releases Bitcoin Buy Signal; MajiDaBro's ETH Liquidation Incurs Losses of 30.35 Million
Bitcoin has continued to decline to around $67,950, with MicroStrategy founder Michael Saylor reiterating a buy-the-dip strategy. Huang Licheng's highly leveraged ETH position was completely liquidated, with losses exceeding $30.35 million. Fidelity has called on the US SEC to improve its regulatory framework for crypto assets. US stocks have broadly declined, and market sentiment remains cautious.
MarketWhisper2h ago
