
**Date: **Sat, Jan 03, 2026 | 06:10 AM GMT
As the 2026 kicks off, the broader cryptocurrency market is showing renewed stability. Bitcoin (BTC) and Ethereum (ETH) are both trading slightly in the green, with ETH posting gains of over 3% today. This steady performance among major assets has helped improve overall market sentiment, allowing select altcoins — including Bitcoin Cash (BCH) — to form constructive technical setups.
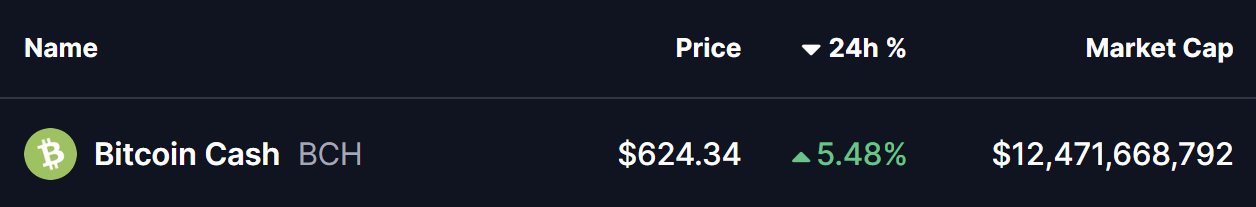
Bitcoin Cash is already responding positively, jumping nearly 5% on the day. However, beyond the short-term price move, the daily chart reveals a much more important development. BCH appears to be completing a classic reversal structure, hinting that the recent strength may be the early stage of a larger trend shift rather than just a temporary bounce.
Source: Coinmarketcap
Rounding Bottom in Play?
On the daily timeframe, Bitcoin Cash is forming a rounding bottom pattern, a well-known bullish reversal formation that signals a gradual transition from selling pressure to sustained accumulation. Unlike sharp V-shaped reversals, rounding bottoms reflect patience from buyers and fading control from sellers over an extended period.
This structure began taking shape after BCH faced a strong rejection near the $630 level in September 2025. That rejection triggered a sharp sell-off, pushing price down to the $446.9 region. Crucially, bears failed to force a deeper breakdown. Instead, strong demand emerged, price stabilized, and volatility gradually compressed — laying the foundation for the rounded base visible on the chart.
As weeks passed, BCH began to print higher lows, slowly curving upward and completing the bottoming structure. The recovery has now brought price back toward the $600–$630 resistance zone, which marks the neckline of the rounding bottom and represents a key decision area for the trend.
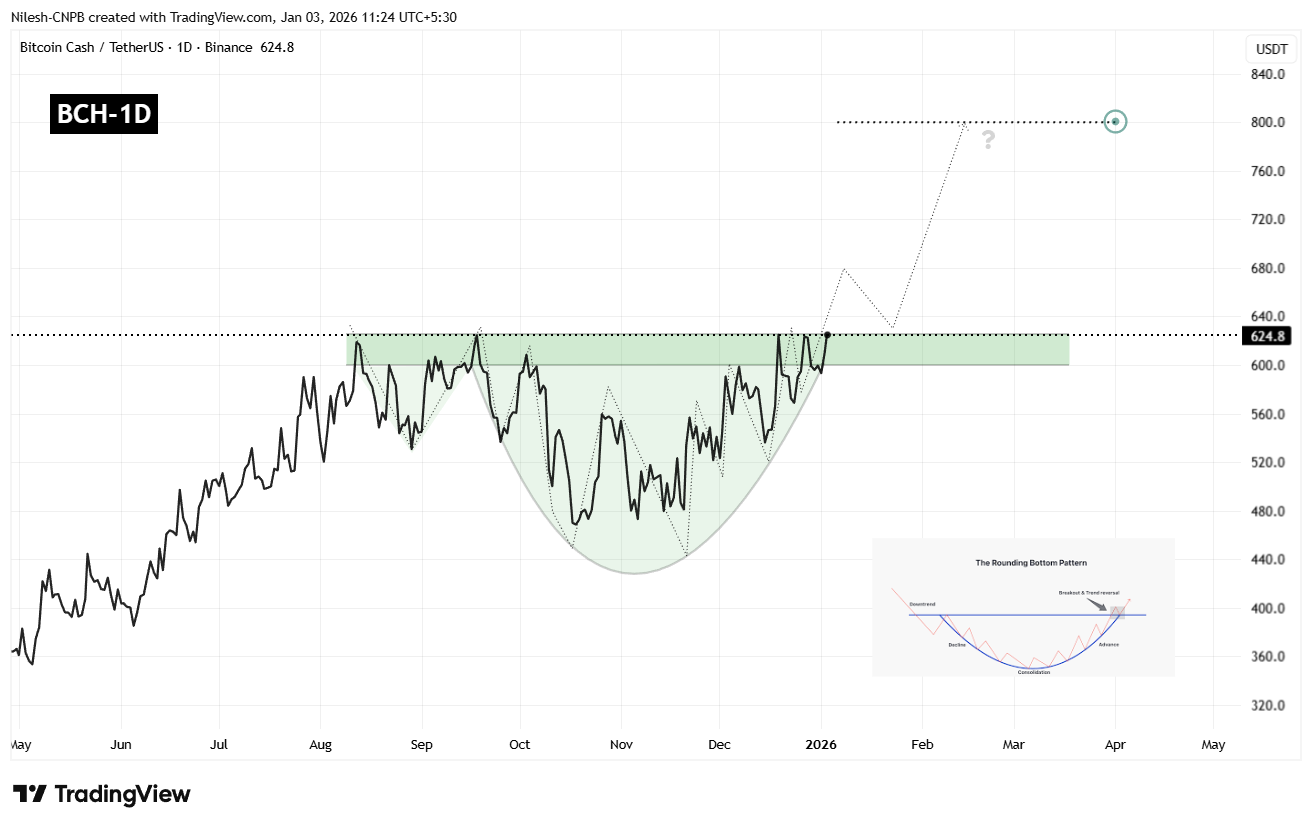
Bitcoin Cash (BCH) Daily Chart/Coinsprobe (Source: Tradingview)
Key Resistance in Focus
At present, BCH is trading near $624, repeatedly testing the $600–$630 zone. This area has historically acted as a supply zone, rejecting price advances multiple times in the past. A decisive daily close above this range would confirm a bullish breakout and signal a shift in market structure.
If bulls manage to push through this resistance and flip it into support, it would strongly validate the rounding bottom pattern and open the door for a continuation rally.
What’s Next for BCH?
A confirmed breakout above $630, followed by a successful retest of the zone as support, would significantly strengthen the bullish outlook. Based on the depth of the rounding bottom formation, the measured upside target points toward the $800–$820 region.
Reaching that level would represent a potential upside of approximately 27% from current prices, aligning well with historical behavior following similar rounding bottom breakouts.
That said, patience remains essential. Before a clean breakout occurs, BCH could still see short-term pullbacks — potentially toward the rising base of the rounded structure or near-term moving averages, which have acted as dynamic support during the recovery. Such retracements would not invalidate the bullish setup as long as price continues to hold above higher low levels.
For now, the $600–$630 zone remains the line in the sand. How BCH behaves around this resistance in the coming sessions will likely determine whether it enters a sustained bullish phase or remains range-bound a bit longer.
Disclaimer: The views and analysis presented in this article are for informational purposes only and reflect the author’s perspective, not financial advice. Technical patterns and indicators discussed are subject to market volatility and may or may not yield the anticipated results. Investors are advised to exercise caution, conduct independent research, and make decisions aligned with their individual risk tolerance.
About Author: Nilesh Hembade is the Founder and Lead Author of Coinsprobe, with over 5 years of experience in the cryptocurrency and blockchain industry. Since launching Coinsprobe in 2023, he has been providing daily, research-driven insights through in-depth market analysis, on-chain data, and technical research.
Disclaimer: The information on this page may come from third parties and does not represent the views or opinions of Gate. The content displayed on this page is for reference only and does not constitute any financial, investment, or legal advice. Gate does not guarantee the accuracy or completeness of the information and shall not be liable for any losses arising from the use of this information. Virtual asset investments carry high risks and are subject to significant price volatility. You may lose all of your invested principal. Please fully understand the relevant risks and make prudent decisions based on your own financial situation and risk tolerance. For details, please refer to
Disclaimer.
Related Articles
NYDIG Research Director: Bitcoin price fluctuations are only 1/4 influenced by stock market correlation
NYDIG Research Director Greg Cipolaro pointed out that the recent rise of Bitcoin alongside the U.S. stock software sector is mainly driven by macro factors rather than structural convergence. He stated that only a quarter of Bitcoin price movements are related to the stock market, with 75% of the factors coming from other areas, emphasizing its role as a diversification tool in investment portfolios.
GateNews11m ago
332.09 BTC transferred from an anonymous address to a certain CEX, valued at approximately $134 million
Gate News Report, March 9th, according to Arkham data, at 11:43, 332.09 BTC (worth approximately $134 million) was transferred from an anonymous address (starting with bc1qnzx...) to a certain CEX.
GateNews13m ago
NYDIG Latest Report: Bitcoin's Correlation with Tech Stocks is Overestimated, 75% of Price Fluctuations Come from Cryptocurrency Market Factors
NYDIG points out that the recent synchronized movement between Bitcoin and U.S. tech stocks is primarily due to macroeconomic factors rather than structural correlation. Although their prices are similar, Cipolaro emphasizes that the rise in Bitcoin and tech stocks more reflects a common change in liquidity and risk appetite rather than fundamental convergence. Bitcoin's volatility remains mainly driven by its own market factors, and its diversification value in investment portfolios still exists.
GateNews14m ago
Bitcoin Falls to $66,000 Amid Oil Price Spike and Geopolitical Risks, Analysts Advise Cautious Positioning
Bitcoin has declined to approximately $66,000 as of March 9, 2026, retreating 10 percent from the $73,500 peak reached on March 5, as surging crude oil prices above $110 per barrel and escalating Middle East tensions drive risk-off sentiment across global markets.
CryptopulseElite33m ago
War risk shocks global markets: oil prices surge past $110, Asian stock markets plummet, Bitcoin stays steady at $67,000
Middle Eastern geopolitical risks have intensified, leading to a sharp decline in Asian stock markets, a surge in energy prices, and crude oil surpassing $110. Despite market concerns, cryptocurrencies like Bitcoin remain stable. Oil prices are expected to continue rising, but some traders anticipate a correction. The Federal Reserve's interest rate expectations remain stable, and future oil price increases could impact inflation.
GateNews38m ago