
**Date: **Mon, Jan 05, 2026 | 07:04 AM GMT
As 2026 kicks off, the broader cryptocurrency market is showing renewed stability. Ethereum (ETH) is up around 4% on the week, and improving sentiment is gradually spreading across major altcoins — including the AI-focused blockchain token Near Protocol (NEAR).
NEAR has already gained more than 10% on a weekly basis, but the more important development is unfolding beneath the surface. Recent price action points to a notable structural shift — one that could mark the early stages of a bullish continuation if key resistance levels are reclaimed.
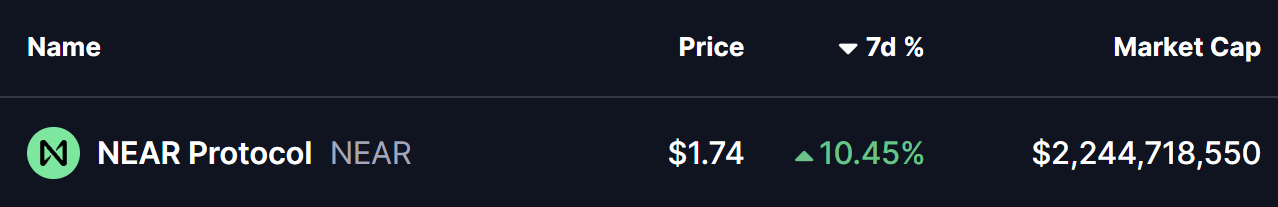
Source: Coinmarketcap
Rounding Bottom in Play
On the daily timeframe, NEAR appears to be forming a rounding bottom pattern, a classic bullish reversal structure that typically emerges after a prolonged corrective phase. This pattern reflects a gradual transition from distribution to accumulation, as selling pressure fades and buyers slowly regain control.
The setup began after NEAR faced a firm rejection near the $1.88 region late last month. That rejection triggered a sharp decline, dragging price down toward the $1.40 area. Importantly, sellers failed to push price meaningfully lower from there, and strong demand emerged at those levels. Over time, NEAR stabilized, volatility compressed, and price began to curl higher — completing the rounded base structure.
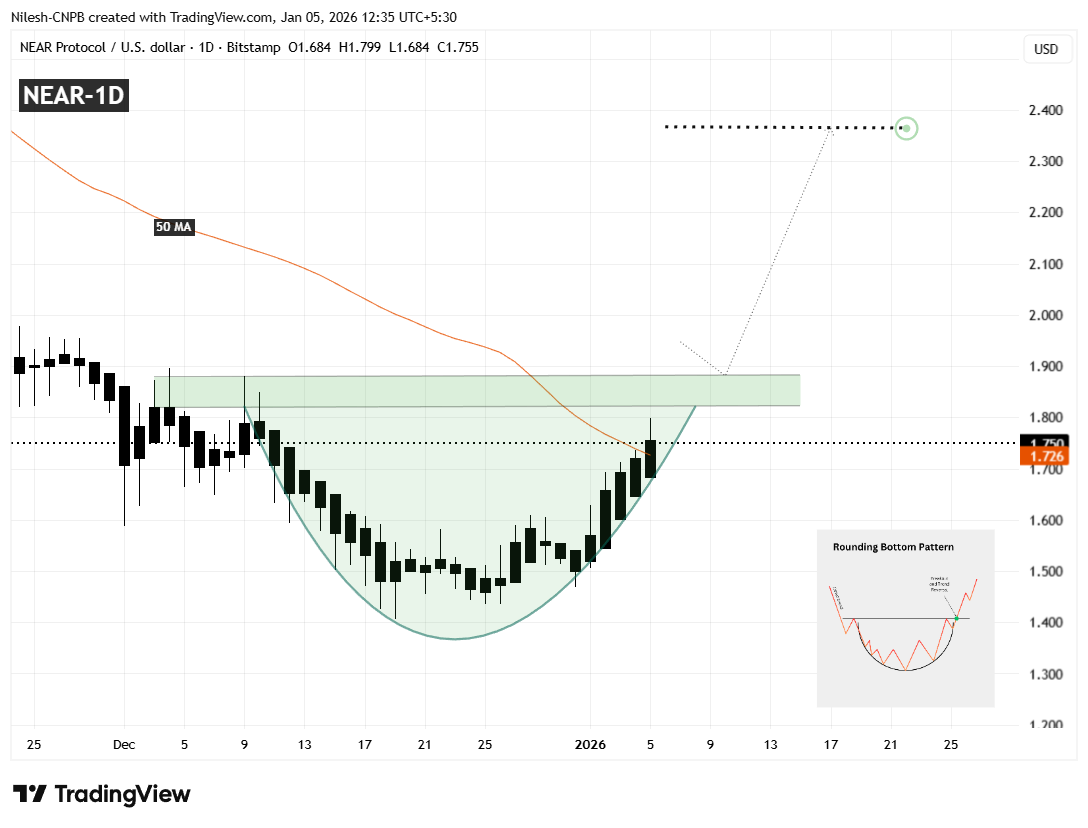
Near Protocol (NEAR) Daily Chart/Coinsprobe (Source: Tradingview)
After reclaiming the 50-day moving average near $1.726, NEAR has shown improving momentum. Currently, price is trading around the $1.75 level and pressing up against a well-defined resistance zone between $1.82 and $1.88. This area represents the neckline of the rounding bottom pattern and has capped upside attempts multiple times in the past, making it the most critical level to watch in the near term.
What’s Next for NEAR?
If NEAR continues to hold the 50-day moving average as support, a clean daily close above the $1.82–$1.88 resistance zone would confirm the bullish rounding bottom breakout. A successful breakout followed by a retest of this zone as support would significantly strengthen the bullish case and signal that a new upward leg is underway.
Based on the depth of the rounding structure, the projected upside target points toward the $2.36 region. Reaching that level would imply a potential upside of roughly 35% from current prices, aligning well with the measured move typically associated with this pattern.
That said, patience remains important. Before any confirmed breakout, NEAR could still experience short-term pullbacks — including a dip toward the rising base of the rounding structure, which has been acting as dynamic support during the recovery. Such pullbacks would not invalidate the bullish setup as long as price continues to hold above the higher-low structure.
Until a decisive breakout and follow-through occur, traders may want to remain cautious and avoid chasing price. The $1.82–$1.88 zone remains the line in the sand that will determine whether NEAR transitions into a sustained bullish phase or remains range-bound for longer.
Disclaimer: The views and analysis presented in this article are for informational purposes only and reflect the author’s perspective, not financial advice. Technical patterns and indicators discussed are subject to market volatility and may or may not yield the anticipated results. Investors are advised to exercise caution, conduct independent research, and make decisions aligned with their individual risk tolerance.
About Author: Nilesh Hembade is the Founder and Lead Author of Coinsprobe, with over 5 years of experience in the cryptocurrency and blockchain industry. Since launching Coinsprobe in 2023, he has been providing daily, research-driven insights through in-depth market analysis, on-chain data, and technical research.
Disclaimer: The information on this page may come from third parties and does not represent the views or opinions of Gate. The content displayed on this page is for reference only and does not constitute any financial, investment, or legal advice. Gate does not guarantee the accuracy or completeness of the information and shall not be liable for any losses arising from the use of this information. Virtual asset investments carry high risks and are subject to significant price volatility. You may lose all of your invested principal. Please fully understand the relevant risks and make prudent decisions based on your own financial situation and risk tolerance. For details, please refer to
Disclaimer.
Related Articles
BloFin Research: Circle Stablecoin Survives Bear Market, OCC Becomes the Biggest Critical Variable
BloFin Research report analyzes Circle's profit model, primarily driven by three factors: "interest rates, USDC scale, and distribution economics." However, OCC's new interpretation of the "GENIUS Act" could pose a serious threat to the collaboration between Circle and Coinbase, affecting USDC distribution efficiency. The report also notes that the stablecoin supply is decoupled from the crypto market prices, indicating that Circle's reserve income is more stable.
MarketWhisper17m ago
NYDIG Research Director: Bitcoin price fluctuations are only 1/4 influenced by stock market correlation
NYDIG Research Director Greg Cipolaro pointed out that the recent rise of Bitcoin alongside the U.S. stock software sector is mainly driven by macro factors rather than structural convergence. He stated that only a quarter of Bitcoin price movements are related to the stock market, with 75% of the factors coming from other areas, emphasizing its role as a diversification tool in investment portfolios.
GateNews23m ago
NYDIG Latest Report: Bitcoin's Correlation with Tech Stocks is Overestimated, 75% of Price Fluctuations Come from Cryptocurrency Market Factors
NYDIG points out that the recent synchronized movement between Bitcoin and U.S. tech stocks is primarily due to macroeconomic factors rather than structural correlation. Although their prices are similar, Cipolaro emphasizes that the rise in Bitcoin and tech stocks more reflects a common change in liquidity and risk appetite rather than fundamental convergence. Bitcoin's volatility remains mainly driven by its own market factors, and its diversification value in investment portfolios still exists.
GateNews26m ago
Raoul Pal lists 12 reasons to go long against the trend: Global liquidity is accelerating expansion, and the crypto market's "most oversold" condition will reverse.
Raoul Pal points out 12 reasons for the expansion of global liquidity during market pessimism, believing that the crypto market is about to reverse. He mentions factors such as the rebound in US fiscal liquidity and policy bullishness, and emphasizes that the market bottom could be confirmed within two weeks. The only risk is rising oil prices, with an expectation that they will move upward in the future.
動區BlockTempo32m ago
War risk shocks global markets: oil prices surge past $110, Asian stock markets plummet, Bitcoin stays steady at $67,000
Middle Eastern geopolitical risks have intensified, leading to a sharp decline in Asian stock markets, a surge in energy prices, and crude oil surpassing $110. Despite market concerns, cryptocurrencies like Bitcoin remain stable. Oil prices are expected to continue rising, but some traders anticipate a correction. The Federal Reserve's interest rate expectations remain stable, and future oil price increases could impact inflation.
GateNews50m ago