
**Date: **Mon, Jan 05, 2026 | 10:58 AM GMT
As 2026 kicks off, the broader cryptocurrency market is showing renewed stability. Both Bitcoin (BTC) and Ethereum (ETH) are up more than 6% on the week, and improving sentiment is gradually spreading across major altcoins — including the DeFi heavyweight Aave (AAVE).
AAVE has gained over 8% on a weekly basis, but the more important story is unfolding beneath the surface. While short-term strength is encouraging, the bigger development lies in the broader market structure forming on the higher timeframe. Recent price action suggests a meaningful shift in behavior — one that could mark the early stages of a bullish continuation if key technical levels hold.
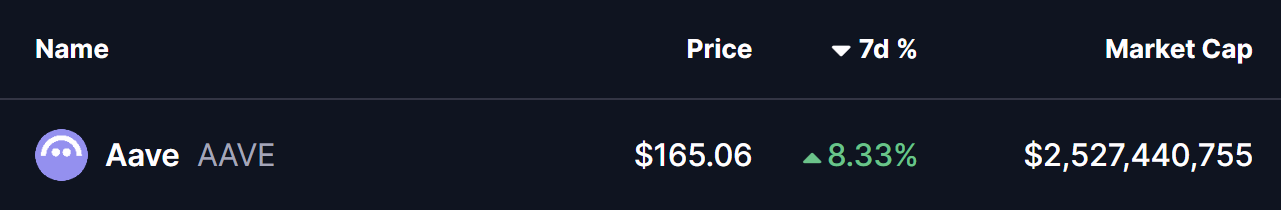
Source: Coinmarketcap
Symmetrical Triangle in Play
On the weekly chart, **AAVE **continues to trade within a symmetrical triangle, a neutral yet powerful pattern that often precedes a major volatility expansion once price approaches its apex.
The structure began forming after AAVE’s strong rally earlier in 2025. However, in August 2025, price faced firm rejection near the triangle’s descending resistance around $385, triggering a sharp corrective move. That pullback resulted in a 62% decline, eventually driving price down toward the triangle’s ascending support trendline near $143.53 last month.
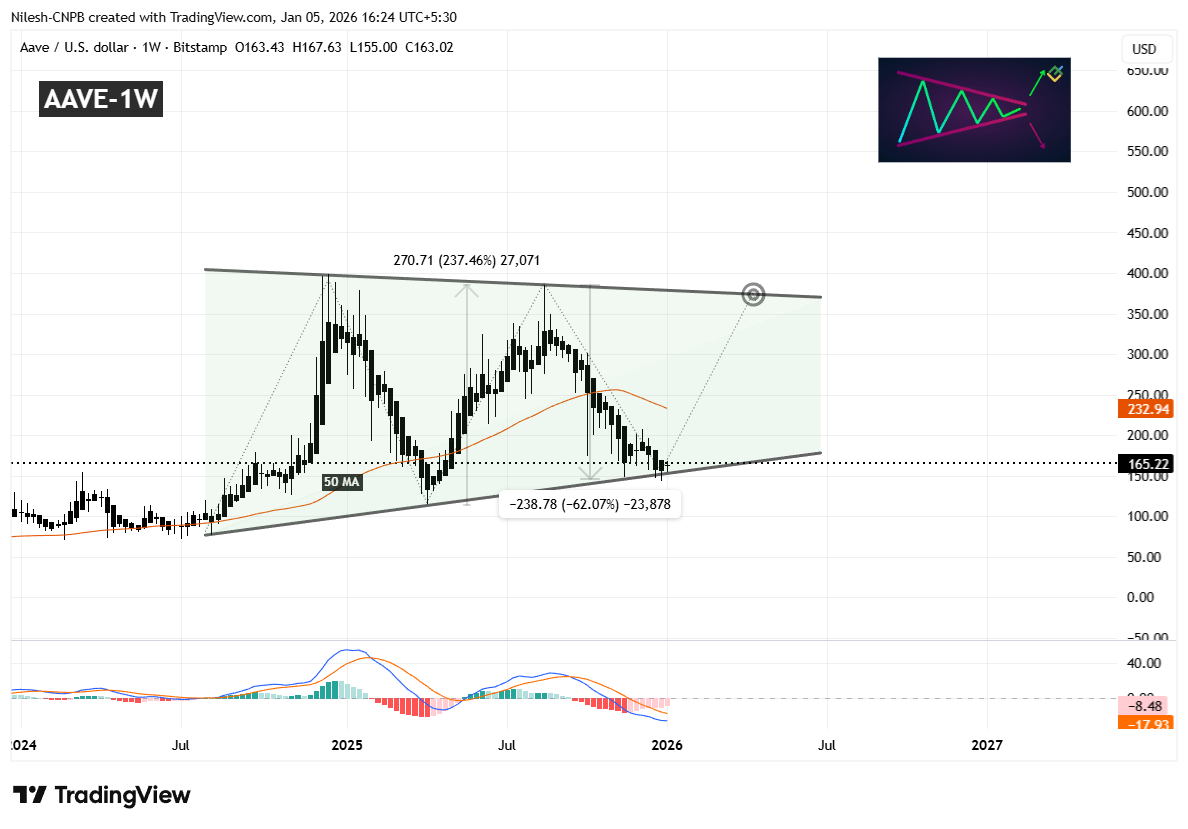
Aave (AAVE) Weekly Chart/Coinsprobe (Source: Tradingview)
Crucially, buyers once again stepped in to defend this long-term support zone. The successful reaction from this level has pushed AAVE back toward the $164 region, signaling renewed buying interest. Notably, this rebound is occurring as the MACD shows early signs of stabilization — a setup that closely resembles conditions seen before AAVE’s previous 237% rally in April 2025.
The next major technical hurdle lies at the 50-week moving average, currently positioned near $232.94. This level has acted as dynamic resistance during the recent decline, and reclaiming it would mark a meaningful shift in medium-term momentum.
What’s Next for AAVE?
If the pattern continues to develop as expected, AAVE could soon attempt a sustained move above the 50-week MA. A confirmed reclaim of this level — followed by acceptance above it — would strengthen the bullish case and increase the probability of a move toward the upper boundary of the triangle near $375.
Such a move would imply a potential upside of roughly 125% from current levels, assuming broader market conditions remain supportive and momentum continues to build.
Until then, patience remains key. Holding above the ascending support trendline is essential for preserving the bullish structure. Any sustained breakdown below this level would weaken the setup and delay the breakout thesis.
For now, the chart suggests AAVE is at a critical inflection point, where compression within the triangle could soon give way to a decisive move — with the direction likely defined by how price behaves around the 50-week moving average.
Disclaimer: The views and analysis presented in this article are for informational purposes only and reflect the author’s perspective, not financial advice. Technical patterns and indicators discussed are subject to market volatility and may or may not yield the anticipated results. Investors are advised to exercise caution, conduct independent research, and make decisions aligned with their individual risk tolerance.
About Author: Nilesh Hembade is the Founder and Lead Author of Coinsprobe, with over 5 years of experience in the cryptocurrency and blockchain industry. Since launching Coinsprobe in 2023, he has been providing daily, research-driven insights through in-depth market analysis, on-chain data, and technical research.
Disclaimer: The information on this page may come from third parties and does not represent the views or opinions of Gate. The content displayed on this page is for reference only and does not constitute any financial, investment, or legal advice. Gate does not guarantee the accuracy or completeness of the information and shall not be liable for any losses arising from the use of this information. Virtual asset investments carry high risks and are subject to significant price volatility. You may lose all of your invested principal. Please fully understand the relevant risks and make prudent decisions based on your own financial situation and risk tolerance. For details, please refer to
Disclaimer.
Related Articles
Bitcoin drops toward $68,000 as demand weakens and whales sell
Bitcoin BTC$68,767.57 slid toward $68,000 on Tuesday, with traditional markets closed in Hong Kong for a long weekend, as repeated failures near $70,000 left the bitcoin market vulnerable to a break lower.
The drop came after another failed push above $70,000, with prices slipping quickly once
CoinDesk3m ago
Bitcoin is hovering around the $68,000 threshold, and the risk of further downside is increasing as whales sell and demand remains weak.
Gate News: Bitcoin’s price has fallen to around $68,000. It had repeatedly failed to break through the $70,000 level, and market momentum has clearly weakened. The current price is still within the $65,000 to $73,000 trading range, but the risk of testing the lower end of the range is rising.
GateNews7m ago
Santiment Alert: BTC profit-loss ratio hits 2.95, the top signal is approaching
Based on Santiment data, Bitcoin’s profit-to-loss trade ratio has reached 2.95:1, nearing the historical alert level of 3.0, which may signal a short-term price top. A high profit-to-loss ratio also reflects optimistic market sentiment, but it can also build up selling pressure. Historical cases show that a profit-to-loss ratio near 3.0 does not necessarily lead to a pullback; the market needs to combine multiple indicators for a comprehensive analysis.
MarketWhisper23m ago
Freedom of Money surges 50%, as CZ’s new book drives a wave of same-name meme coin hype
Meme coin Freedom of Money saw a major surge of 50% on April 7, with its market value exceeding $22 million, driven by market sentiment after CZ announced that a new book is set to be released. However, the coin has no official connection to CZ or Binance, and its rally is purely a market-sentiment hype; investors should be cautious of the risks stemming from a lack of fundamental support.
MarketWhisper30m ago
The crypto market is broadly down; only the RWA sector is up slightly, at 0.42%.
On April 7, the crypto market fell broadly, with only the RWA sector up slightly by 0.42%. Major coins Bitcoin and Ethereum declined by 0.34% and 0.43%, respectively. Other sectors generally contracted, but some projects such as Creditcoin and Centrifuge rose against the trend.
GateNews1h ago
Tom Lee has released a post-war asset ranking, with Ethereum outperforming the broader market to win second place.
Tom Lee said on CNBC that since the start of geopolitical conflicts, Ethereum has outperformed the broader market, posting a gain of more than 8% and ranking second globally. Wartime fiscal spending is expected to grow, which will provide support for the market. BitMine recently holds more than 4.8 million Ether—equivalent to more than 4.8 million Ethereum—showing bullish confidence and strategy.
MarketWhisper2h ago
