
Key Takeaways
-
Canton (CC) surged over 13%, outperforming the broader crypto market amid widespread weakness.
-
The daily chart confirms a Cup and Handle breakout, a bullish reversal pattern.
-
CC has broken above the handle resistance near $0.1413, signaling early bullish momentum.
-
The key neckline resistance lies between $0.1586–$0.1685, which remains the next major hurdle.
-
A successful breakout above the neckline could open the door for a measured move toward $0.2752.
Canton Coin (CC), the native utility token of the Canton Network — a privacy-enabled public Layer-1 blockchain — is quietly stepping into the spotlight. While the broader crypto market remains under pressure, CC is flashing relative strength, posting an impressive 13% daily gain and standing out among largely red charts.
Beyond the price jump, what’s drawing attention is the technical structure forming on the daily timeframe, which now suggests that CC may be entering the early stages of a larger bullish move.
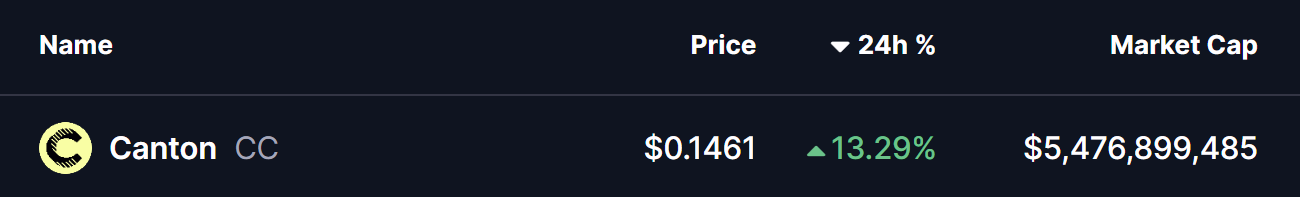
Source: Coinmarketcap
Cup and Handle Breakout Signals Trend Shift
On the daily chart, Canton has completed a textbook Cup and Handle formation, a bullish reversal pattern that often marks the transition from accumulation into trend continuation.
The “cup” portion of the pattern began forming in November, following a sharp rejection from the $0.1586–$0.1685 resistance zone. Price then sold off aggressively, eventually bottoming near $0.062, before gradually rounding out — a sign that selling pressure was fading and buyers were slowly regaining control.
After the rounded base was established, CC entered the “handle” phase, characterized by a short-term downward channel and lower volatility. This phase typically shakes out weak hands before the next move higher.
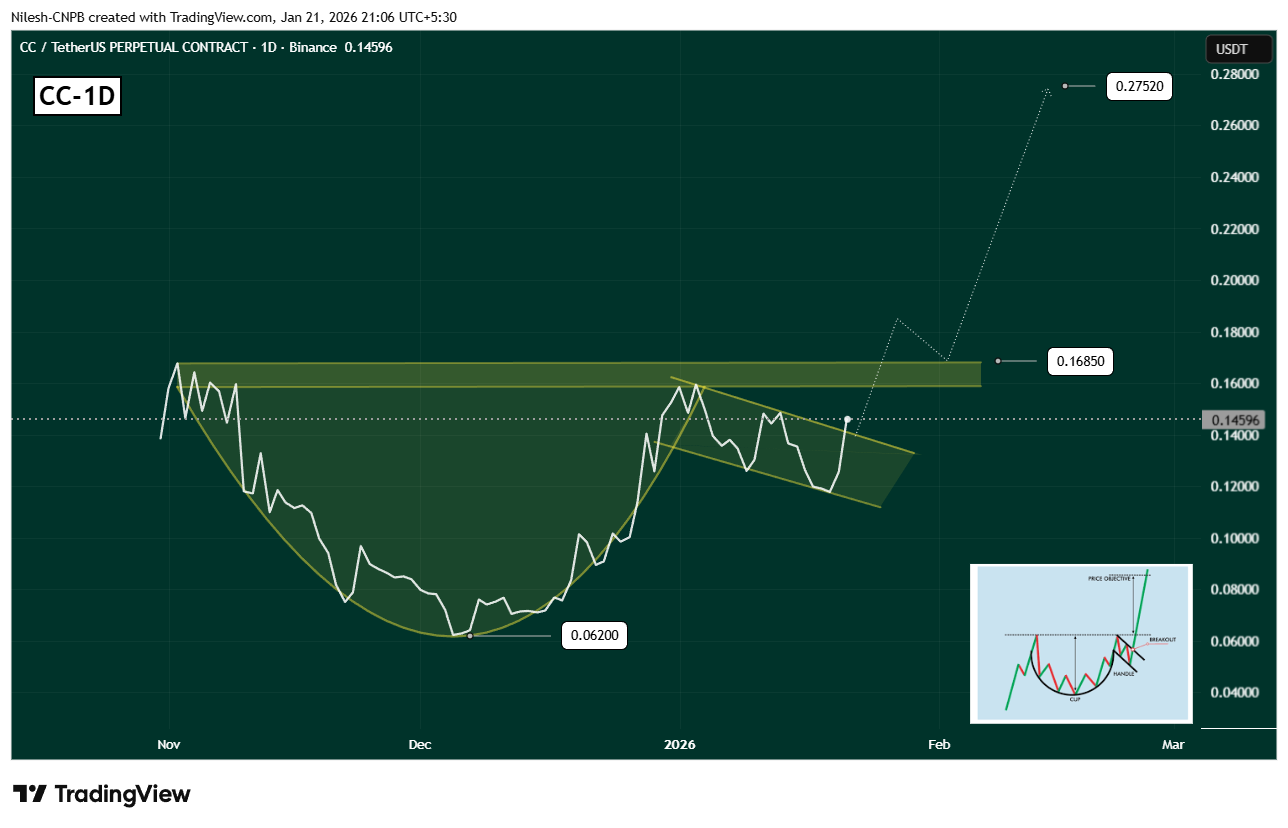
Canton (CC) Daily Chart/Coinsprobe (Source: Tradingview)
That breakout has now arrived.
Price has pushed decisively above the handle resistance near $0.1413, signaling renewed bullish momentum and offering an early indication that the broader pattern may be resolving to the upside.
Momentum Builds Despite Market Weakness
What makes this breakout more notable is the context. CC is advancing while the broader market remains cautious, suggesting relative strength and selective accumulation rather than a purely market-driven bounce.
As long as price holds above the former handle resistance, the breakout structure remains intact and favors continuation rather than immediate rejection.
What Could Come Next for CC?
With the handle breakout done, attention now shifts to the neckline resistance zone between $0.1586 and $0.1685. This area previously acted as strong supply and will likely be the next major test for bulls.
A successful breakout and daily close above this zone would confirm the Cup and Handle pattern and potentially unlock a measured move toward the $0.275 area, based on the depth of the cup formation.
Until that happens, CC may pause or consolidate near current levels, but the overall structure continues to lean bullish as long as price remains above the breakout zone.
For now, Canton Coin appears to be transitioning from accumulation into expansion — and if momentum continues to build, CC could be setting up for a much larger move in the sessions ahead.
Disclaimer: The views and analysis presented in this article are for informational purposes only and reflect the author’s perspective, not financial advice. Technical patterns and indicators discussed are subject to market volatility and may or may not yield the anticipated results. Investors are advised to exercise caution, conduct independent research, and make decisions aligned with their individual risk tolerance.
About Author: Nilesh Hembade is the Founder and Lead Author of Coinsprobe, with over 5 years of experience in the cryptocurrency and blockchain industry. Since launching Coinsprobe in 2023, he has been providing daily, research-driven insights through in-depth market analysis, on-chain data, and technical research.
Disclaimer: The information on this page may come from third parties and does not represent the views or opinions of Gate. The content displayed on this page is for reference only and does not constitute any financial, investment, or legal advice. Gate does not guarantee the accuracy or completeness of the information and shall not be liable for any losses arising from the use of this information. Virtual asset investments carry high risks and are subject to significant price volatility. You may lose all of your invested principal. Please fully understand the relevant risks and make prudent decisions based on your own financial situation and risk tolerance. For details, please refer to
Disclaimer.
Related Articles
Oil Prices Stabilize, Supporting Risk Asset Rally! Wintermute: Bitcoin Rebounds Above $70,000 Reflecting Cooling Geopolitical Risk Premium
Cryptocurrency market maker Wintermute points out that Bitcoin's return to the $70,000 level is due to easing tensions in the Middle East, which has led to a decline in crude oil prices and reduced geopolitical risks. Market concerns about inflation and supply disruptions have eased, with capital flowing toward risk assets. If oil prices remain stable, it could improve Bitcoin's performance; if they rise again, it could suppress Bitcoin's price.
区块客1h ago
Bitcoin steadies above $71,000 as oil falls below $100 after U.S. drafts 15‑point Iran peace plan
The essay discusses a 15-point peace plan aimed at resolving the U.S.-Israel-Iran conflict, reflecting positive market responses like a stable Bitcoin price. It also highlights fluctuating oil prices and their potential impact on inflation and financial markets, emphasizing uncertainty about the plan's effectiveness.
CoinDesk1h ago
How Cryptocurrency ETFs Impact the Market? Identifying Market Trends through ETF Trends in Weak Market Conditions
By 2026, the crypto ETF market has shifted from a regulatory story to an indicator for observing institutional capital flows and Bitcoin price resilience. As the market matures, active strategies will become the new trend, with ETFs no longer serving merely as tools for capital inflows, but as a means for risk allocation. ETF capital flows have become a real-time barometer of market sentiment, with continuous inflows or outflows reflecting shifts in risk appetite. Understanding ETF functionality lies in confirming market structure rather than predicting price, particularly in weak markets where inflows demonstrate underlying demand.
区块客1h ago
Bitcoin ETF Ends Seven-Day Rally, Bitcoin Price Pressure Resurfaces
Recently, U.S. Bitcoin spot ETFs experienced significant outflows after consecutive seven trading days of net inflows, with net outflows of $163.5 million on the 18th and an additional $51.9 million on the 19th, indicating simultaneous weakening of market capital and prices. Bitcoin prices temporarily broke below $70,000, highlighting that ETF capital flows can no longer support its rebound, while deteriorating macroeconomic conditions have created pressure on risk assets, causing investor preference to noticeably contract. The test of the $70,000 level has become a barometer of short-term market sentiment.
区块客1h ago
Conflicting Ceasefire Signals Between US and Iran! Analysts: Iran's Next Move Will Determine Bitcoin's Direction
The United States is pushing for a ceasefire agreement with Iran, but Iranian media denies there are negotiations. These contradictory messages triggered market volatility, with stocks briefly rising, oil prices falling, and Bitcoin rebounding. Analysts point out that Iran's refusal of peace talks helps maintain its influence, market expectations of easing tensions or continued tensions will directly impact Bitcoin's price, and the future direction of the situation still requires monitoring of subsequent diplomatic developments.
MarketWhisper1h ago
