
Key Takeaways
-
Algorand (ALGO) is consolidating after a 13% decline over the past 60 days, while showing stabilization in the last month.
-
The daily chart reveals a repeating bullish fractal, similar to the setup that triggered ALGO’s 300% rally in November 2024.
-
Price is holding inside a long-term accumulation zone between $0.11 and $0.1530.
-
The 200-day moving average near $0.1912 is acting as key resistance and breakout confirmation level.
-
A successful reclaim of the 200 MA could open the path toward $0.60 and the ascending resistance trendline, while a drop below $0.11 would invalidate the bullish setup.
ALGO, the native token of Algorand’s Layer-1 blockchain, has shown steady but muted momentum over the past 30 days, helping slow down its broader correction. Despite this stabilization, ALGO remains down more than 13% over the last 60 days, keeping sentiment cautious across the market.
That said, when looking beyond short-term price noise, the daily chart is beginning to tell a familiar story. The current structure closely resembles a bullish fractal that, in the past, preceded a powerful breakout rally—raising an important question for traders: is this just consolidation, or a quiet accumulation phase before the next move?
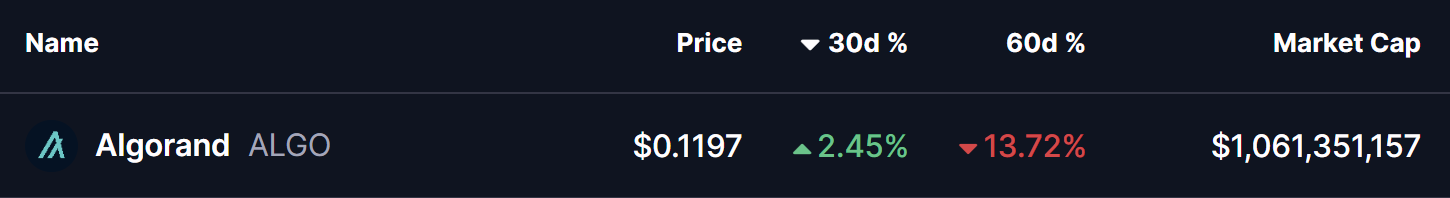
Source: Coinmarketcap
Fractal Setup Hints at a Bullish Reversal
On the daily timeframe, ALGO is displaying early signs of a repeating bullish structure, built around three key technical elements:
-
A rejection from the long-term ascending resistance trendline
-
A prolonged accumulation zone at major historical support
-
A potential reclaim of the 200-day moving average
The current corrective phase began in December 2024, when ALGO was rejected near the ascending resistance trendline around $0.60. That rejection triggered a deep pullback of more than 80%, eventually driving price back into the long-term demand zone between $0.11 and $0.1530—a region that has repeatedly acted as an accumulation area on the chart.
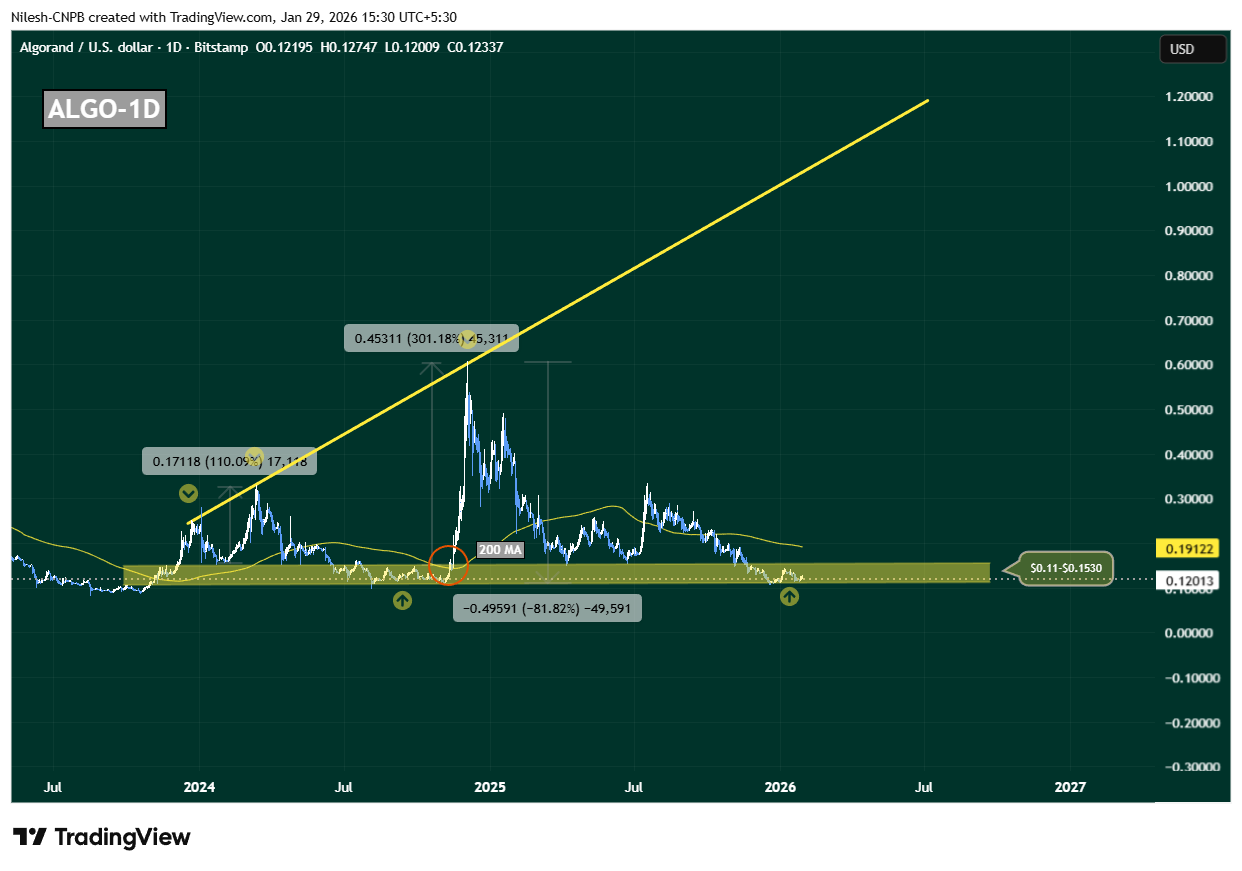
Algorand (ALGO) Daily Chart/Coinsprobe (Source: Tradingview)
This zone is not just technically important; it has also served as a launchpad during previous cycles, where downside momentum stalled and long-term buyers quietly stepped in.
History Rhymes on the ALGO Chart
What makes this setup particularly compelling is how closely it mirrors November 2024’s breakout structure. Back then, ALGO spent extended time consolidating near the same support band before reclaiming the 200-day moving average. Once that level flipped into support, price accelerated sharply—resulting in a 300% rally toward the ascending resistance trendline.
Today, ALGO is once again compressing inside this accumulation range, while the 200-day moving average sits overhead near $0.1912, acting as dynamic resistance. This alignment suggests the market may be approaching another inflection point.
What’s Next for ALGO?
At present, ALGO is hovering near $0.12, firmly inside its long-term accumulation zone. As long as price holds above this region, the broader bullish fractal remains intact.
A clean and sustained reclaim of the 200-day moving average around $0.1912 would be a critical confirmation signal. If bulls manage to flip this level into support, it would closely replicate previous breakout conditions and could trigger a sharp upside expansion. In that scenario, $0.60 becomes a realistic medium-term target, with further upside possible toward the ascending resistance trendline if momentum builds.
However, the structure is not without risk. A decisive breakdown below $0.11 would weaken the accumulation thesis, signal loss of long-term support, and open the door for deeper downside.
For now, ALGO sits at a make-or-break zone. The chart suggests patience is key—but if history repeats, this quiet phase may not last much longer.
Disclaimer: The views and analysis presented in this article are for informational purposes only and reflect the author’s perspective, not financial advice. Technical patterns and indicators discussed are subject to market volatility and may or may not yield the anticipated results. Investors are advised to exercise caution, conduct independent research, and make decisions aligned with their individual risk tolerance.
About Author: Nilesh Hembade is the Founder and Lead Author of Coinsprobe, with over 5 years of experience in the cryptocurrency and blockchain industry. Since launching Coinsprobe in 2023, he has been providing daily, research-driven insights through in-depth market analysis, on-chain data, and technical research.
Disclaimer: The information on this page may come from third parties and does not represent the views or opinions of Gate. The content displayed on this page is for reference only and does not constitute any financial, investment, or legal advice. Gate does not guarantee the accuracy or completeness of the information and shall not be liable for any losses arising from the use of this information. Virtual asset investments carry high risks and are subject to significant price volatility. You may lose all of your invested principal. Please fully understand the relevant risks and make prudent decisions based on your own financial situation and risk tolerance. For details, please refer to
Disclaimer.
Related Articles
XRP Open Interest Drops 75%, But Stablecoin Fragmentation Intensifies XRP Bridge Demand
XRP open interest declined approximately 75%, indicating that leveraged traders are exiting the market, but stablecoin fragmentation may increase bridge demand for XRP. Evernorth Holdings' IPO application demonstrates that institutions still view XRP's long-term value positively. The overall market faces macroeconomic pressure, with weak short-term momentum structure.
MarketWhisper1h ago
Japanese Yen Rate Hike Hopeless? Japanese Bonds Collapse with "Yields at 27-Year High," Strait of Hormuz Conflict Strangling Japan's Economy
Japan's 10-year government bond yield rose to 2.32%, approaching a 27-year high, with markets concerned that geopolitical tensions will impact the economy and crypto markets. Trump's 48-hour ultimatum to Iran has sent energy prices soaring, and Japan's critical crude oil shipping routes face threats, potentially worsening inflation. The Bank of Japan faces a dilemma between rate hikes and economic recovery, while rising yields could trigger investor liquidations, impacting risk assets like Bitcoin.
動區BlockTempo1h ago
Pi Network Price Surge Outpaces Market, Protocol 20 Upgrade Boosts Market Confidence
Pi Network's recent price has risen to $0.198, outperforming the broader crypto market, primarily driven by capital rotation and the launch of a new token platform developed through Protocol 20 upgrades. Analysts point out that PI's gains reflect fundamental improvements rather than passive market influences. Going forward, PI's price movement will be affected by altcoin season indices and market sentiment, with $0.20 serving as resistance and $0.19 as support.
MarketWhisper2h ago
XRP Today's News: SOPR Approaching Historical Signal of 1, Bottom Signal Emerging
XRP has continued to underperform since the start of the year, failing to attract market capital, with current trading prices below major moving averages. SOPR and NUPL indicators show bottom signals, but these are only probabilistic characteristics. $1.51 serves as a near-term bullish-bearish dividing line, with breakouts potentially triggering a bullish rebound. The market maintains a cautious stance on XRP's short-term strong rebound, with the probability of returning to $2 at only 5%.
MarketWhisper2h ago
Bitcoin Falls Below $69,000, Derivatives Market Shifts to Defense, Downside Risks Intensify
10x Research analysis points out that Bitcoin has broken below $69,000, marking a shift in market structure. Traders have significantly adjusted positions, with increased futures liquidations and negative funding rates. Options capital flows are moving toward downside protection, signaling hedging demand against downside risks. Meanwhile, market expectations regarding rate increases are diverging from the Federal Reserve's rate-cutting guidance, which could impact risk asset performance.
GateNews2h ago
Hyperliquid Surpasses CME Pricing Status, On-Chain Commodity Trading Volume Breaks $173.4 Billion
Hyperliquid's HIP-3 board has achieved billion in trading volume over the past 7 days, primarily driven by WTI crude oil contracts, demonstrating strong market activity. Powered by the US-Iran conflict, the platform's 24/7 trading functionality has made it an important source for price discovery, replacing traditional exchanges. As Hyperliquid adapts to CFTC regulations, it aims to maintain financial neutrality, but how to balance compliance requirements with the advantages of decentralized trading remains a challenge.
MarketWhisper3h ago
